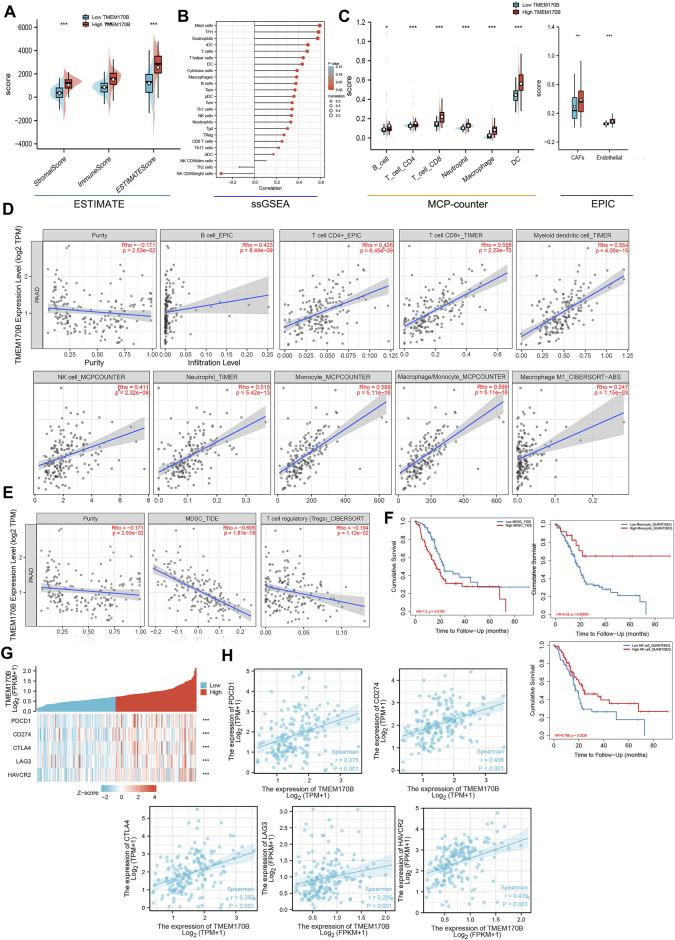
FIGURE 7.
Correlation analysis between TMEM170B expression and immune infiltration of multiple immune cells. (A) Violin plot showing the differential StromalScore, ImmuneScore, and ESTIMATEScore of high and low TMEM170B expression. (B) The correlation between TMEM170B expression level and 24 immune cell types. (C–D) The correlation between TMEM170B expression and antitumor immune cell infiltration, including that of B cells, CD8+T cells, CD4+T cells, myeloid dendritic cells, natural killer cells, neutrophils, monocyte and M1 macrophages. (E) The correlation between TMEM170B expression and the infiltration of immunosuppressive cells, including myeloid-derived suppressor cells and regulatory T cells. (F) Kaplan-Meier analysis results based on the extent of monocyte, natural killer cells and yeloid-derived suppressor cells infiltration in PAAD. Red represents high immune cells infiltration, and blue represents low immune cells infiltration. (G,H) The gene-by-gene correlation analysis of common ICP genes and TMEM170B expression. *p < 0.05; **p < 0.01; ***p < 0.001.

