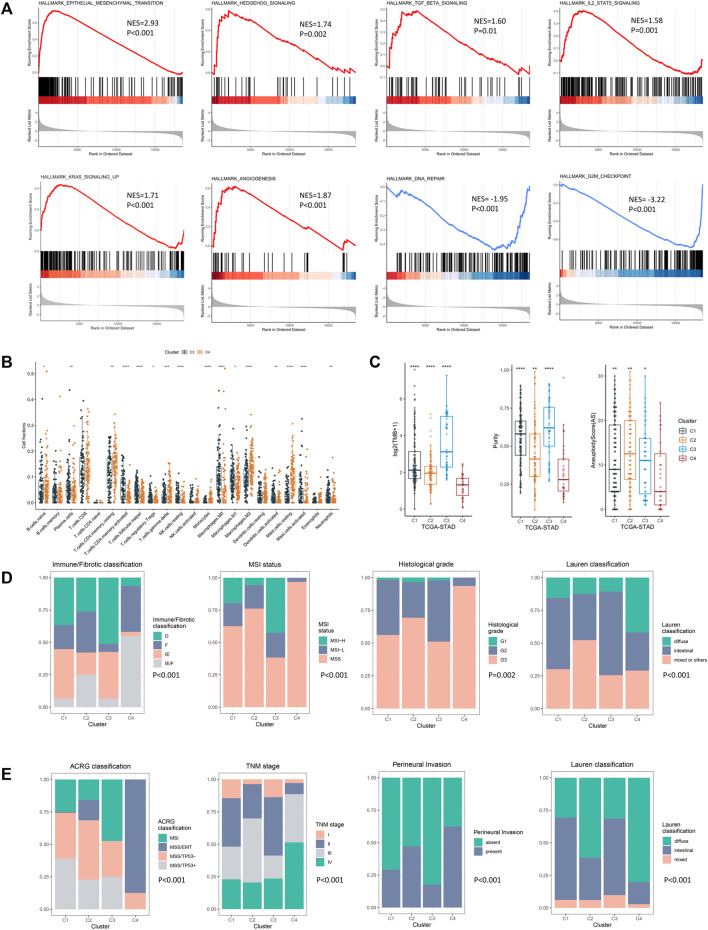
FIGURE 5.
Molecular and clinical characteristics of four epigenetic modification patterns. (A) GSEA analysis identified the differentially activated pathways of cluster C4 compared with cluster C3. (B) CIBERSORT analysis estimated the relative ratio of tumor-infiltrating cells in clusters C3 and C4. Each value was defined as the relative ratio compared to the 22 human hematopoietic cell types contained in CIBERSORT. (C) Different TMB, tumor purity, and aneuploidy score among four clusters in the TCGA-STAD cohort. (D) Clinical relevance of the EMD subtype in the TCGA-STAD cohort. (E) Clinical relevance of the EMD subtype in the GSE62254 cohort (*p < 0.05, **p < 0.01, ***p < 0.001, and ****p < 0.0001).

