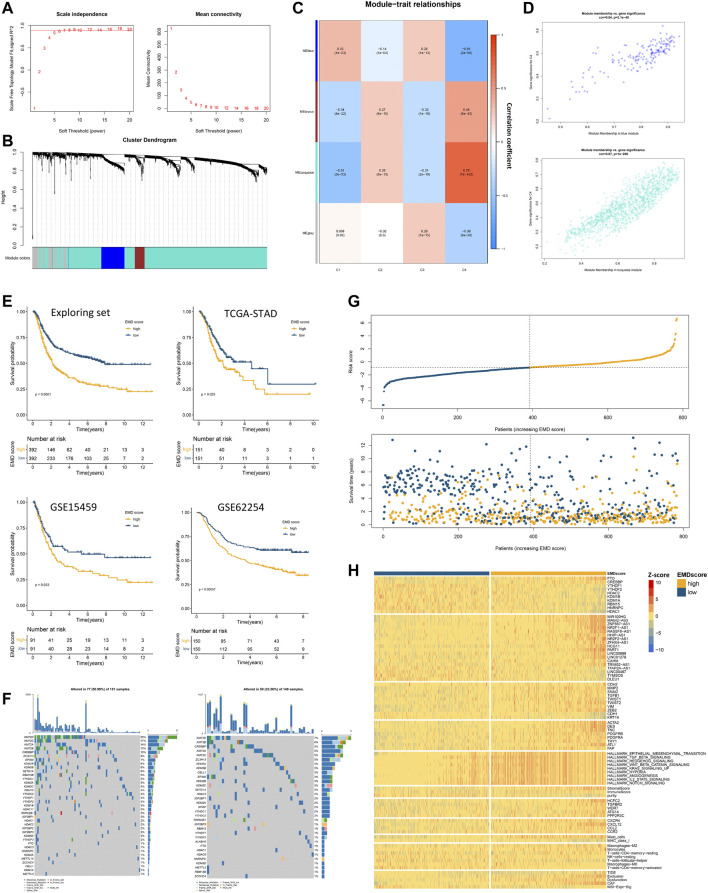
FIGURE 6.
Construction of the EMD score in the exploring set. (A–D) WGCNA analysis based on 1674 DEGs in the exploring set. (E) Kaplan–Meier curves showed the different overall survival between the high- and low-EMD score groups in the exploring set. Patients were separated into the high and low groups according to the median EMD score of each cohort. (F) Mutation landscape of epigenetic regulators in high- and low-EMD score groups in the TCGA-STAD cohort. (G) Risk curves showed more frequent death events with the increasing EMD score in the exploring set. Dots in yellow referred to death events observed in the cohorts. (H) Heatmap showed the close correlations of the EMD score with various molecular characteristics including epigenetic regulators, EMRLs, TME markers, oncogenes, and tumorigenic pathways. All the values were scaled using the Z-score.

