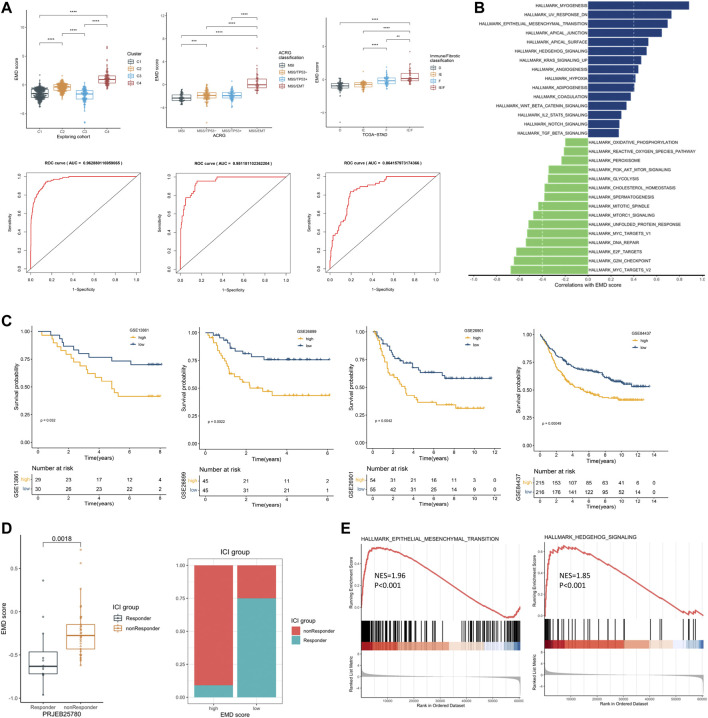
FIGURE 7.
Recognizing patients with EMD characteristics using the EMD score. (A) Differential EMD score of subtypes in three classification proposals. The ROC below showed the performance of the EMD score in recognizing the EMD, MSS/EMT, and IE/F subtype in the corresponding cohort. (B) Hallmark pathways correlated with the EMD score in the validation set. (C) Kaplan–Meier curves showed the different overall survival between the high and low EMD groups in the validation set. Patients were separated into high and low groups according to the median EMD score of each cohort. (D) Correlations of the EMD score with the ICI outcome in the cohort PRJEB25780. Patients were divided into high or low groups according to the lower quartile (Q1) of the EMD scores (right panel). (E) GSEA analysis suggested significant activated EMT and Hedgehog pathways in non-responders compared with the responder.

