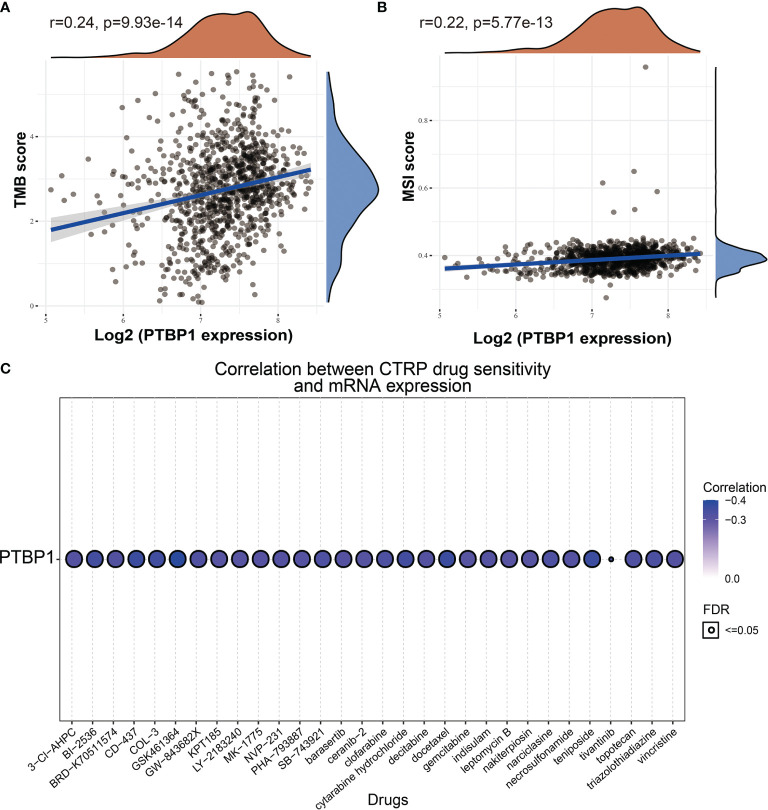
Figure 11.
Analysis of the correlation between PTBP1 expression and TMB, MSI and drug sensitivity. (A) The correlation between the PTBP1 expression and TMB in LUAD. (B) The correlation between the PTBP1expression and MSI in LUAD. (C) The correlation between the PTBP1 expression and drug sensitivity.

