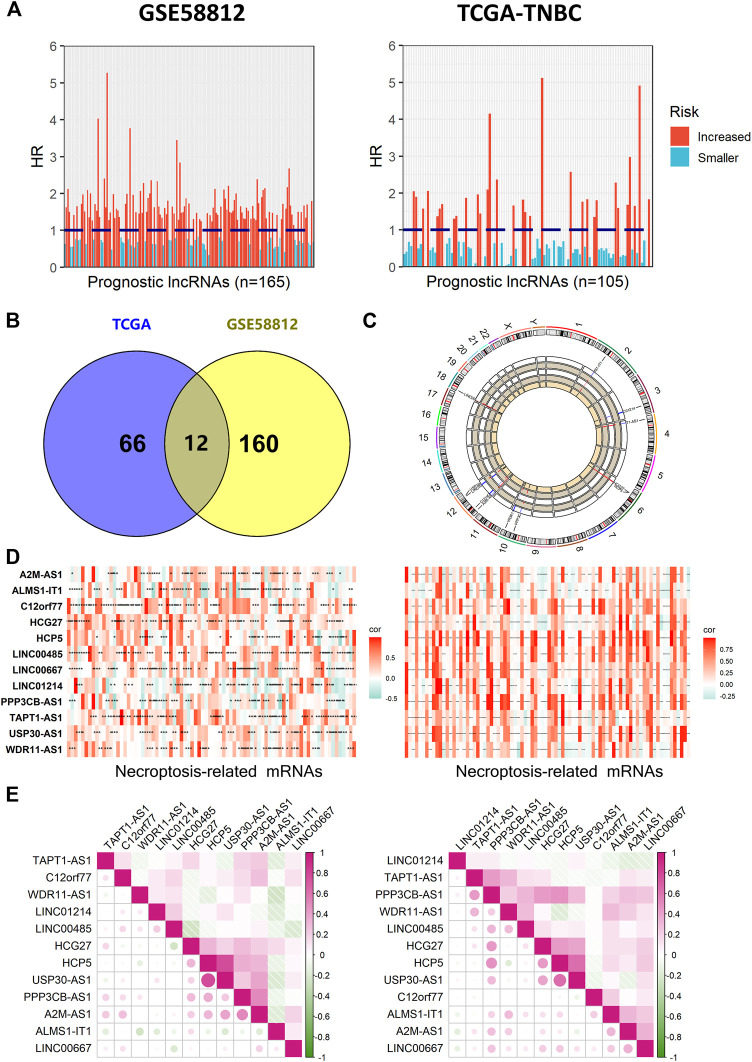
FIGURE 2.
Identification of prognostic necroptosis-related lncRNAs in patients with TNBC. (A) Results of univariate Cox regression of OS with 165 lncRNAs in GSE58812 and 105 lncRNAs in TCGA. (B) Venn diagram to identify common lncRNAs of GSE58812 and TCGA cohorts. (C) Circos plot representing the position and expression levels of 12 necroptosis-related lncRNAs. (D) Pearson correlation coefficient (r) between necroptosis-related lncRNA and the corresponding mRNA was calculated and shown by heat map (***, **, and * indicate p < 0.001, <0.01, and <0.05, respectively). (E) Demonstration of correlations between the 12 significant lncRNAs from each other.

