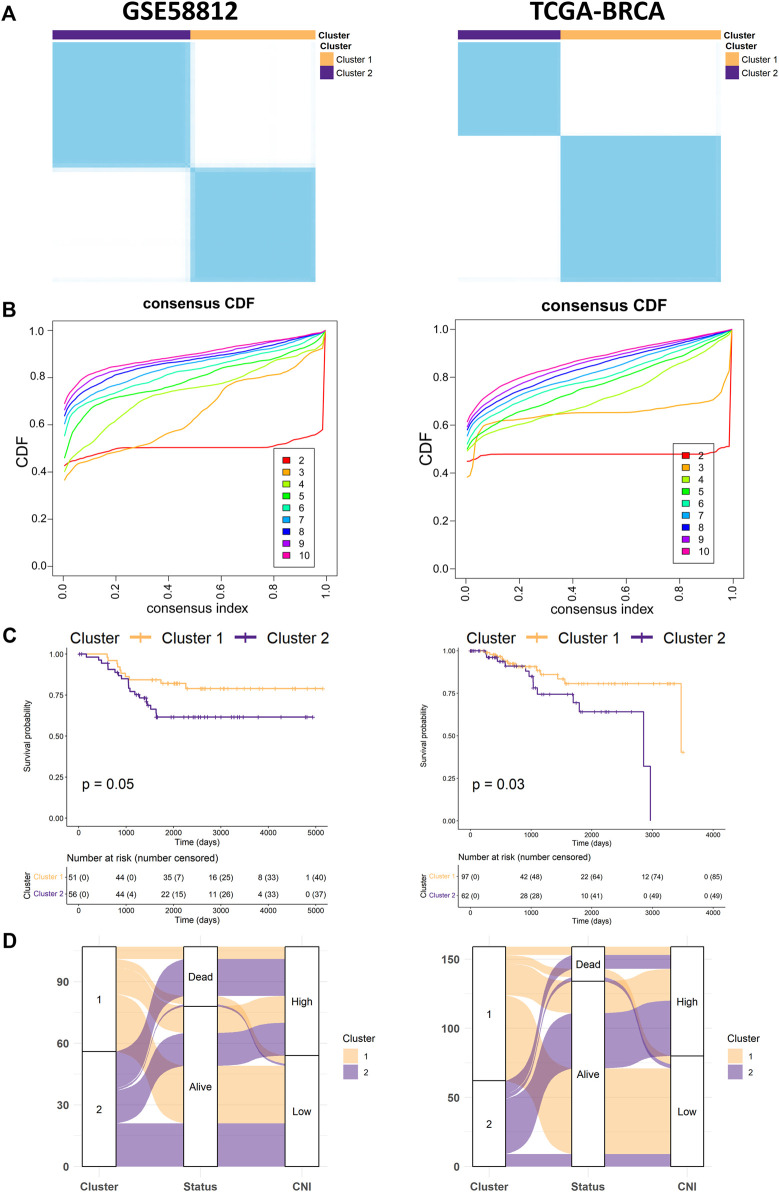
FIGURE 7.
Identification of potential subgroups using unsupervised consensus clustering. (A,B) Consensus clustering matrixes and cumulative distribution function (CDF) plots, which found k = 2 was the optimal cluster number not only in the training cohort (left) but also in the validation cohort (right). (C) Kaplan–Meier survival curves for OS of the TNBC patients with cluster 1 and cluster 2 in the training (left) and validation cohorts (right). (D) The alluvial diagram fully demonstrated the correlation of prognosis between the clusters and CNI values in both the training set (left) and validation set (right).

