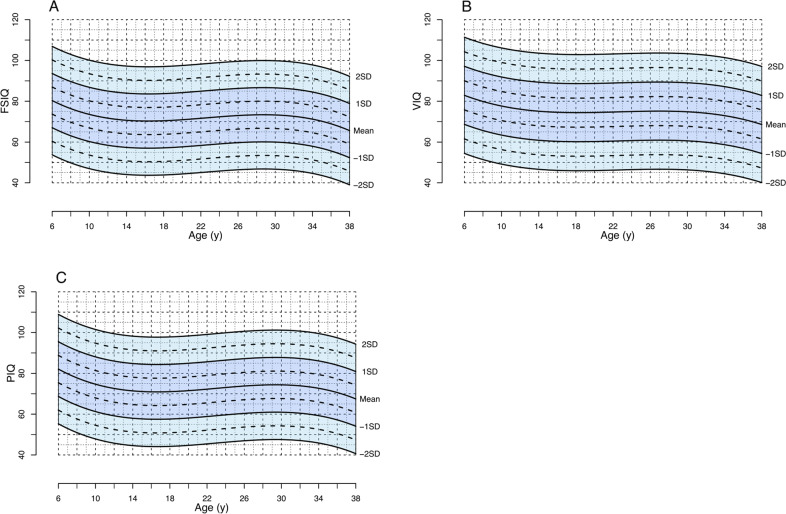
Fig. 2. 22q11DS-specific normative chart for FSIQ (A), VIQ (B), and PIQ (C) over time.
These figures represent the normative charts for IQ development in individuals with the 22q11.2 deletion (A: FSIQ, B: VIQ, C: PIQ). The lines represent the observed average IQ trajectories (“Mean”), and the observed trajectories that deviate ±1 or 2 SDs from the mean. The normcharts are derived from 2512 IQ assessments in 1365 individuals with the 22q11.2 deletion between the ages of 6 and 38 years. These figures represent the normative charts for IQ development in individuals with the 22q11.2 deletion (A: FSIQ, B: VIQ, C: PIQ). The lines represent the observed average IQ trajectories (“Mean”), and the observed trajectories that deviate ±1 or 2 SDs from the mean. The normcharts are derived from 2512 IQ assessments in 1365 individuals with the 22q11.2 deletion between the ages of 6 and 38 years.

