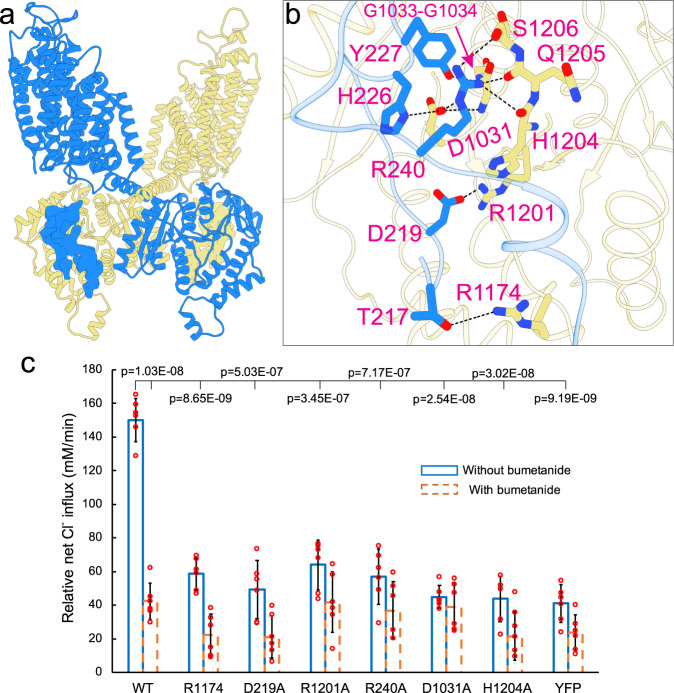
Fig. 2. An N-terminal phosphoregulatory segment associates with the C-terminal domain.
a An N-terminal segment shown as density map interacts with a swapped C-terminal domain shown as ribbon. b An enlarged view highlights residues involved in association of the N- and C-terminal domains. Polar contacts are indicated as dashed lines. c Cl− transport rates in insect cells of wildtype NKCC1 and mutants designed to disrupt the N- and C-terminal domain interface. Each circle represents one kinetic measurement of a single sample in a 96 well plate. Unpaired one-tailed Student’s t tests are used for statistical analyses (n = 6; data are presented as mean values ± SD).

