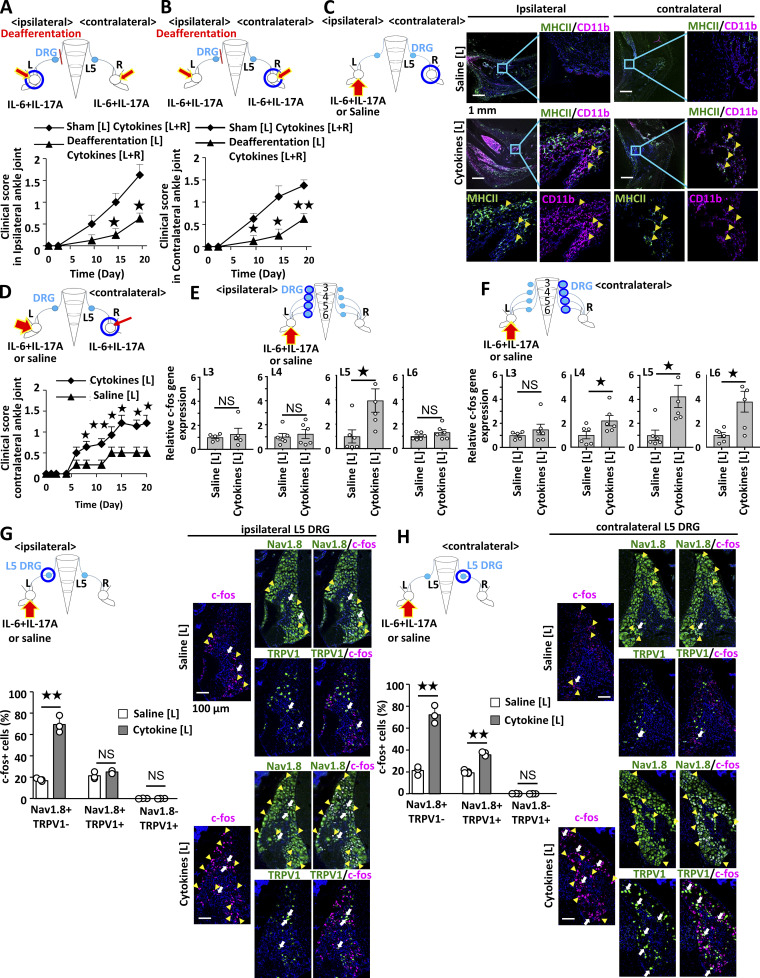
Figure 1.
Activated sensory pathways are involved in bilateral ankle joint inflammation. (A and B) Clinical scores of the left (A) and right (B) ankles of F759 mice deafferented or sham-operated at L5 DRG of the left side. IL-17A and IL-6 (0.1 μg each) were injected into both ankles on days 0, 1, and 2 (n = 4 per group). (C) CD11b+MHC II+ cells in the ankle joints of F759 mice on day 3 after IL-17A and IL-6 or saline injections. IL-17A and IL-6 or saline (1 μg each) were injected into the left ankle joint on days 0, 1, and 2. Green, MHC II. Magenta, CD11b. Blue, nuclei. Bars, 1 mm. Arrowheads show CD11b+MHC II+ cells. Experiments were performed at least three times independently; representative data are shown. (D) Clinical scores of the right ankle joint of F759 mice after IL-17A and IL-6 injections at a low dose (0.01 μg each) in the right ankle joint and high dose (1 μg each) or saline injection in the left ankle joint on days 0, 1, and 2 (n = 14 per group). Mean scores ± SEM are shown. P values were calculated using the Wilcoxon rank-sum test (*, P < 0.05; **, P < 0.01). (E and F) IL-17A and IL-6 (1 μg each) or saline was injected into the left ankle joint on days 0, 1, and 2. c-fos expression in ipsilateral (E) or contralateral (F) L3, L4, L5, and L6 DRGs on day 3 using real-time PCR (n = 5–6 per group). (G and H) IL-17A and IL-6 (1 μg each) or saline was injected into the left ankle joint on days 0, 1, and 2, followed by staining of c-fos, Nav1.8, and TRPV1 in the ipsilateral (G) or contralateral (H) L5 DRG on day 3. Magenta, c-fos. Green, Nav1.8 or TRPV1. Blue, nuclei. Yellow arrowheads show c-fos+Nav1.8+TRPV1− neurons. White arrows show c-fos+Nav1.8+TRPV1+ neurons. The number of c-fos+, Nav1.8+TRPV1−, Nav1.8+TRPV1+, and Nav1.8−TRPV1+ cells was counted (n = 3 per group). Bar graphs show the percentage of c-fos+ cells in the total number of Nav1.8+TRPV1−, Nav1.8+TRPV1+, or Nav1.8−TRPV1+ neurons. Bar, 100 µm. Experiments were performed three times independently. The data are shown as means ± SEM. P values were calculated using Student’s t-tests (*, P < 0.05; **, P < 0.01). Diagrams depicted above or to the left of the graphs illustrate the experimental settings. L, left ankle; R, right ankle. Arrows indicate cytokine or saline injections, and blue circles indicate the ankle joint assessed for arthritis (A–D) or the DRG examined (E–H).

