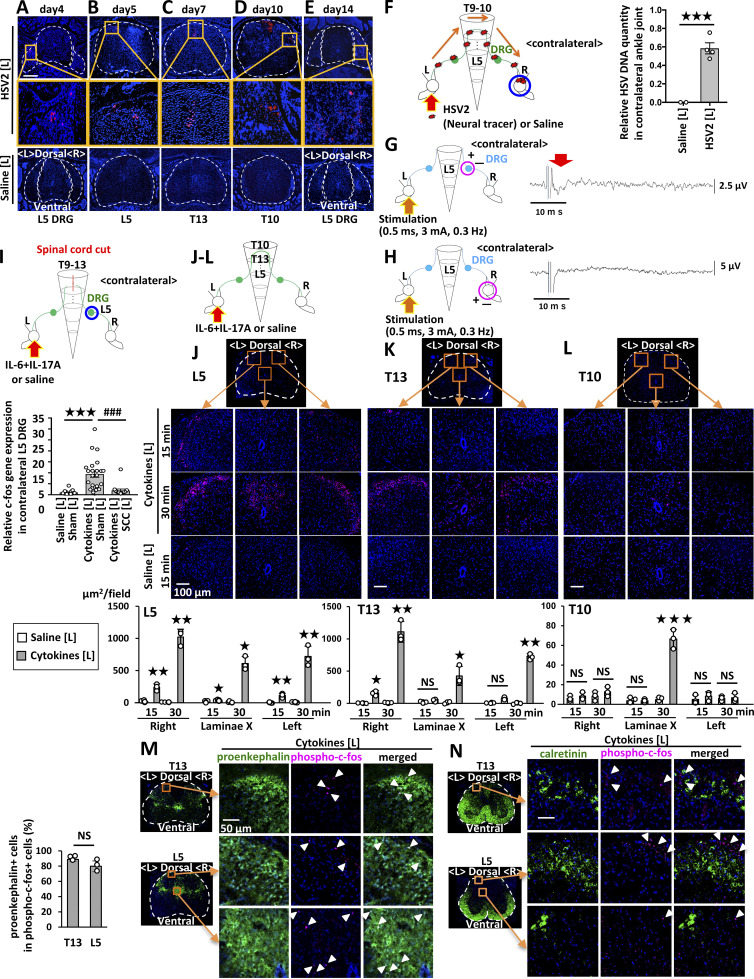
Figure 2.
Cytokine injections into the ankle joints activate neural pathways including proenkepharin+ interneurons in the spinal cord between bilateral joints. (A–E) HSV2 (4.5 × 10⁵ pfu) or saline was injected into the left ankle joint of F759 mice, followed by staining of HSV2 in the spinal cord and L5 DRG on day 4 (A), L5 on day 5 (B), T13 on day 7 (C), T10 on day 10 (D), and L5 DRG on day 14 (E). Nuclear staining by Hoechst 33342 is shown in blue. Broken lines outline the spinal cord and DRG. Magnified images in the orange boxes are shown in the middle row. Sections from control F759 mice given saline injection are shown at the bottom. Experiments were performed at least three times independently; representative data are shown. (F) HSV2 (4.5 × 10⁵ pfu) or saline was injected into the left ankle joints of F759 mice on day 0, followed by the detection of HSV2 DNA in the contralateral (right) ankle joint on day 20 by real-time PCR (n = 2–4 per group). (G and H) An electrical stimulation (0.5 ms, 3 mA, 0.3 Hz) was applied to the left tibial nerves. Electrical signals were detected at the dorsal root (G) or tibial nerve levels (H) on the contralateral (right) side (n = 5 per group). The red arrow shows the electrophysiological signal detected. As a positive control, stimuli were applied to the nerve on the recording (right) side, and compound action potentials were detected at the dorsal root and sciatic nerve levels (not shown). (I) c-fos expression of the right L5 DRG in F759 mice who underwent a spinal cord cut (SCC; T9–T13) or sham operation. IL-17A and IL-6 (1 μg each) or saline were injected into the left ankle on days 0, 1, and 2, and c-fos expression was examined by real-time PCR on day 3 (n = 15–23 per group). Mean scores ± SEM are shown. P values were calculated using Student’s t-tests (F) and Dunnett’s test (I; *** and ###, P < 0.001). Diagrams illustrate the experimental settings. L, left ankle; R, right ankle. Arrows indicate HSV2, cytokine, or saline injections. Blue circles indicate the ankle or DRG examined. (J–L) IL-17A and IL-6 (1 μg each) or saline was injected into the left ankle joint of F759 mice on day 0, followed by the analysis of phosphorylated c-fos expression in the L5 spinal cord (J), T13 spinal cord (K), and T10 spinal cord (L) 15 or 30 min after the last injection. Magenta, phosphorylated-c-fos; Blue, nuclei. Bar, 100 µm. Phosphorylated c-fos positive areas per field (225,625 µm2) were quantified (n = 3 per group). (M and N) IL-17A and IL-6 (1 μg each) or saline was injected into the left ankle joint of F759 mice on day 0, followed by the analysis of phosphorylated c-fos and proenkephalin (M) or calretinin (N) expression in the L5 and T13 spinal cord 15 min after the last injection. Green, proenkephalin (M) or calretinin (N). Magenta, phosphorylated c-fos. Blue, nuclei. Bar, 50 µm. Arrowheads show phosphorylated c-fos signals. Experiments were performed three times independently; representative data are shown. Mean scores ± SEM are shown. P values were calculated using Student’s t-test or Welch’s t-test (J–L; *, P < 0.05, **, P < 0.01, ***, P < 0.001). Diagrams illustrate the experimental settings. L, left ankle; R, right ankle. The arrows indicate cytokine or saline injection.

