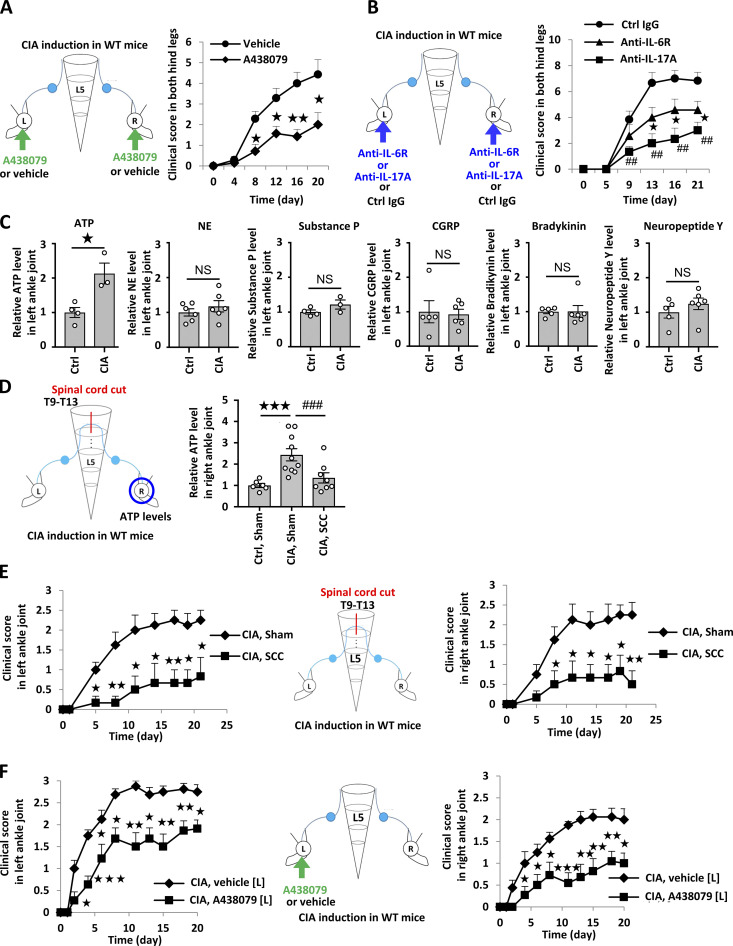
Figure 4.
ATP induces sensory pathway between bilateral joints in WT mice during CIA. (A) CIA was induced in C57BL/6 mice. Clinical scores from both hind legs of CIA mice that received bilateral injections of A438079 every day from days 4–28 after primary immunization (n = 7 per group). (B) Clinical arthritis scores from both hind legs of CIA mice that received bilateral injections of anti–IL-6R antibody (2 μg), anti–IL-17A antibody (2 μg), or control antibody every day from days 14–28 after primary immunization (n = 7 per group). (C) CIA was induced in C57BL/6 mice, followed by the analysis of ATP, norepinephrine (NE), substance P, CGRP, bradykinin, and neuropeptide Y levels in the right ankle joint on day 23 after primary immunization (n = 4–6 per group). Graphs show the relative expression level against the saline-injected group. (D) CIA was induced in C57BL/6 mice after a lengthwise T9–13 spinal cord cut (SCC) or sham-operation (Sham), followed by the analysis of ATP levels in the right ankle joint on day 23 after primary immunization (n = 5–10 per group). (E) Clinical arthritis scores from the left or right ankle joint after a lengthwise T9–13 spinal cord cut (SCC) or sham-operation (Sham; n = 9–10 per group). (F) Clinical arthritis scores from the left or right ankle joint of CIA mice that received unilateral injections of A438079 or vehicle every day from days 14–28 in the left ankle joint (n = 9–10 per group). Mean scores ± SEM are shown. P values were calculated using the Wilcoxon rank-sum test (A, B, E, and F), Student’s t-test (C), and Dunnett’s test (D; *, P < 0.05; ** and ##, P < 0.01; *** and ###, P < 0.001). Diagrams illustrate the experimental settings. L, left ankle; R, right ankle. Arrows indicate A438079, vehicle, or antibody injections. Blue circles indicate the ankle joints examined.

