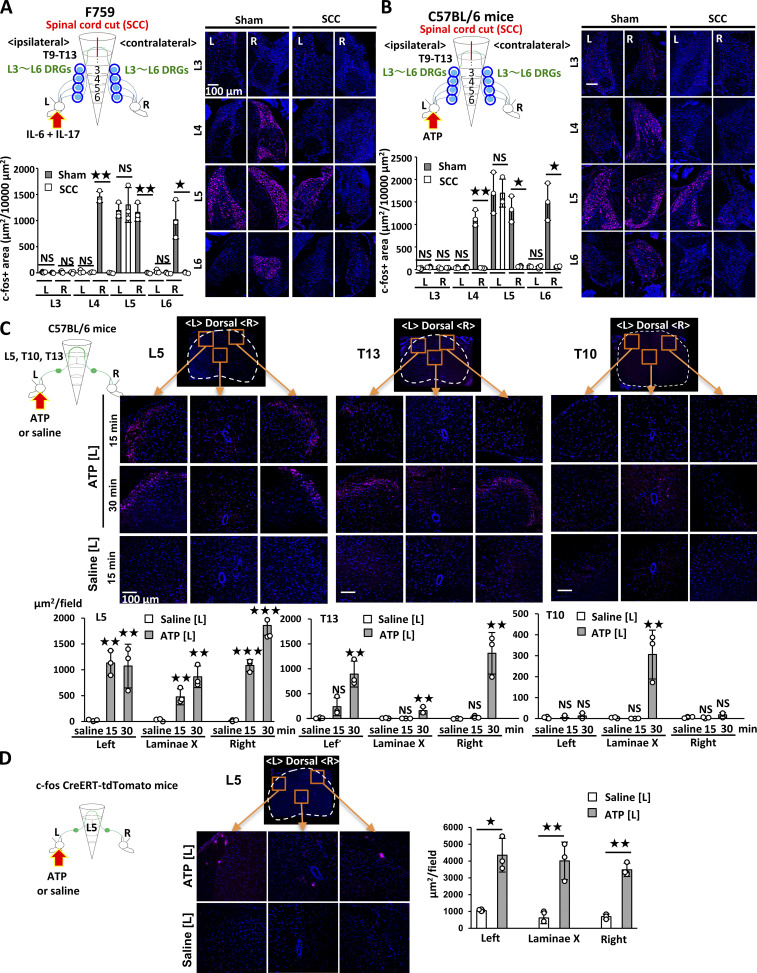
Figure S2.
Neural activation in F759 mice by cytokine injection and WT mice by ATP injection. (A) c-fos expression of the left (L) and right (R) L3–L6 DRGs in F759 mice who underwent a spinal cord cut (SCC, T9–T13) or sham operation. IL-17A and IL-6 (1 μg each) were injected into the left ankle on days 0, 1, and 2, and c-fos expression was examined by immunostaining on day 3 (n = 3 per group). (B) Same as A but ATP (10 μg) was injected into the left ankle on days 0, 1, and 2 (n = 3 per group). For A and B, experiments were performed three times independently. Figures show representative data. c-fos+ areas per 10,000 µm2 were quantified (n = 3 each). Mean scores ± SEM were shown. P values were calculated using Student’s t-tests or Welch test (*, P < 0.05; **, P < 0.01). Diagrams illustrate the experimental settings. L, left ankle; R, right ankle. Arrows indicate location of the injection. Blue circles indicate the ankle or DRG examined. (C) ATP (10 μg) or saline was injected into the left ankle joint of WT mice on day 0, followed by the analysis of phosphorylated c-fos expression in the L5 spinal cord, T13 spinal cord, and T10 spinal cord 15 or 30 min after the last injection. (D) ATP (10 μg) or saline was injected into the left ankle joint of c-fos CreERT-Ai14 mice on day 0, 1, 2, followed by the analysis of tdTomato expression in the L5 spinal cord on day 3. For C and D: Magenta, phosphorylated c-fos (C) or tdTomato (D). Blue, nuclei. Bars, 100 µm. Phosphorylated c-fos+ or tdTomato+ areas per field (225,625 µm2) were quantified (n = 3 per group). Experiments were performed three times independently. Mean scores ± SEM are shown. P values were calculated using Dunnett’s test (C) or Student’s t-test (D; *, P < 0.05; **, P < 0.01; ***, P < 0.001).

