Figure S3.
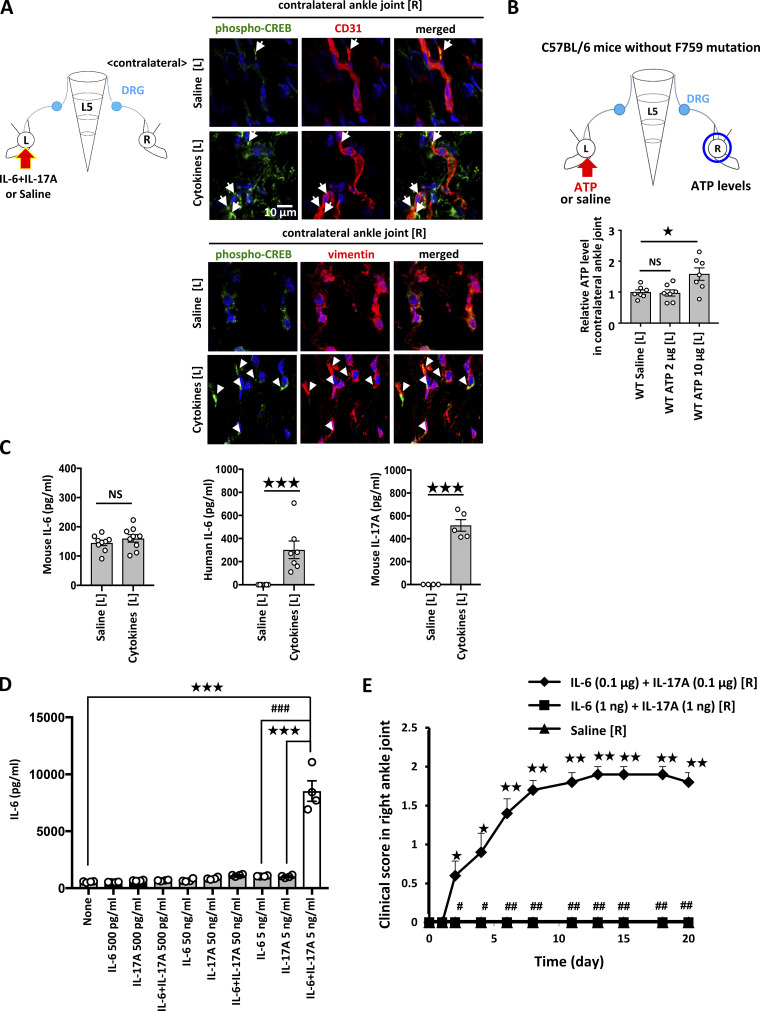
Neural activation by cytokine or ATP injection induced chemokine expressions and ATP synthesis in the ankle joint on the contralateral sides. (A) IL-17A and IL-6 (1 μg each) or saline were injected into the left ankle joint of F759 mice on days 0, 1, and 2, followed by immunostaining for pCREB and CD31 or vimentin in the contralateral (right) ankle joint on day 3. Green, phosphorylated-CREB. Red, CD31 or vimentin. Blue, nuclei. Arrows (CD31) and arrowheads (vimentin) show merged signals. (B) ATP (2 or 10 μg) or saline was injected into the left ankle joint of naive WT mice on days 0, 1, and 2, followed by the analysis of ATP concentration in the contralateral (right) ankle joint on day 3 (n = 7 per group). For A and B, mean scores ± SEM are shown. P values were calculated using Dunnett’s test (*, P < 0.05). The diagrams illustrate the experimental settings. L, left ankle; R, right ankle. Arrows indicate location of the injection. The blue circles indicate the ankle joints examined. (C) IL-17A and IL-6 (1 μg each) or saline were injected into the left ankle joint of F759 mice on days 0, 1, and 2, followed by the measurement of mouse IL-6 (n = 9 per group), human IL-6 (n = 6–7 per group), and mouse IL-17A (n = 4–5 per group) levels in serum on day 3. (D) BC1 endothelial cells were stimulated with a high (50 ng/ml), medium (5 ng/ml each), or low (500 pg/ml each) dose of IL-6 + IL-17A (human IL-6 plus soluble IL-6Rα and/or mouse IL-17A). Culture supernatants were collected and assessed using an ELISA specific for mouse IL-6 (n = 4 per group). (E) IL-17A and IL-6 (0.1 μg or 1 ng each) or saline were injected into the right ankle joint on days 0, 1, and 2. Clinical arthritis scores of the right ankle joint of F759 mice were evaluated (n = 5 per group). Mean scores ± SEM are shown. P values were calculated using Student’s t-test (C), Dunnett’s test (D), and the Wilcoxon rank-sum test (E; * and #, P < 0.05; ** and ##, P < 0.01; *** and ###, P < 0.001).

