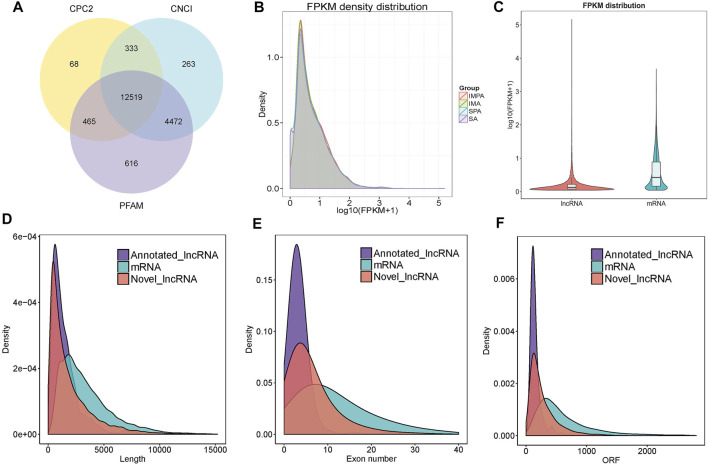
FIGURE 2.
Identification and characterization of lncRNAs in goat, Capra hircus. (A) Venn diagrams of coding potential analysis by using stringent criteria. Three tools (CPC2, CNCI and PFAM) were employed to analyze the coding potential of lncRNAs. Those simultaneously shared by three analytical tools were designated as candidate lncRNAs and used in subsequent analysis. (B) Volcanic maps of differentially expressed RNA. The expression levels of mRNAs and lncRNAs were indicated by log10 (FPKM +1). (C) LncRNA, mRNA expression violin graph. The horizontal coordinate is the molecular type, the vertical coordinate is log10 (FPKM+1) and the width of each violin plot reflects the number of points at that expression level. (D) Length distribution of mRNAs and lncRNAs, unit of the length is bp. (E) Distribution of exon number in the mRNAs and lncRNAs. (F) Open reading frame (ORF) length distribution for mRNAs and lncRNAs.

