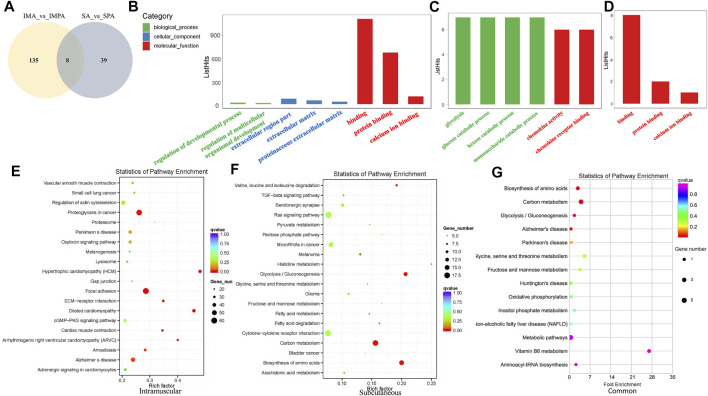
FIGURE 4.
GO and KEGG enrichment analyses of differentially expressed lncRNAs in goat different adipocytes. (A) Venny maps of differentially expressed lncRNAs during intramuscular and subcutaneous preadipocyte differentiation. (B) Categories of biological processes, cellular components and molecular functions of the target genes of differentially expressed lncRNAs (intramuscular adipocytes). (C) Categories of the biological processes and molecular functions of the target genes of differentially expressed lncRNAs (subcutaneous adipocytes). (D) Categories of molecular functions of the target genes of differentially expressed lncRNAs (both subcutaneous and intramuscular adipocytes). (E) Scatter plot of the top 20 pathways enriched for differentially expressed lncRNAs in intramuscular adipocytes before and after differentiation. (F) Scatter plot of the top 20 pathways enriched for differentially expressed lncRNAs in subcutaneous adipocytes before and after differentiation. (G) Scatter plot of the top 15 pathways enriched for differentially expressed lncRNAs in both intramuscular and subcutaneous adipocytes before and after differentiation. The abscissa represents the richness factor, and the ordinate represents the enriched pathway terms. The Q-value represents the corrected p value.

