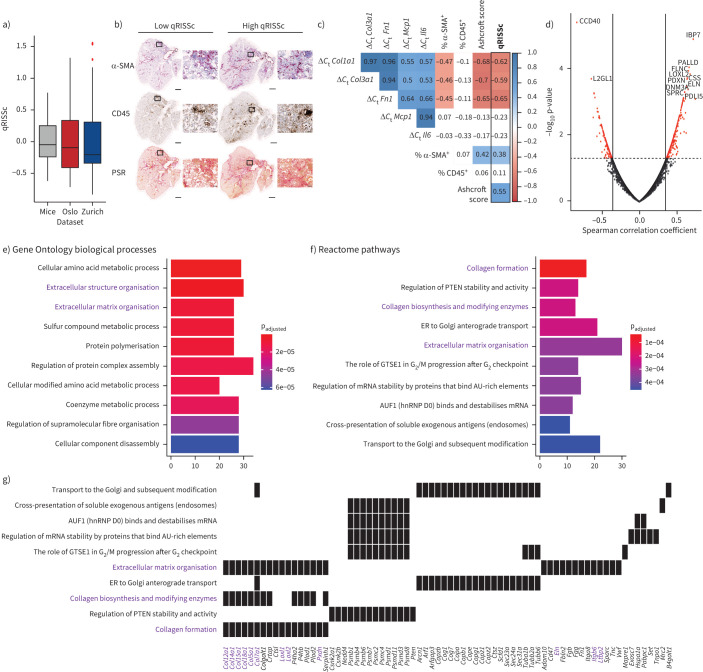
FIGURE 5.
Correlation analysis of the quantitative radiomic risk score (qRISSc) with molecular data in experimental interstitial lung disease (ILD). a) Score distribution across the three datasets, demonstrating a similar qRISSc distribution between mice of the bleomycin-induced lung fibrosis model (n=30) and systemic sclerosis-associated ILD (SSc-ILD) patients (Zurich, n=75; Oslo, n=66). b) Representative histological images of bleomycin-treated mice with low and high qRISSc that were stained for the myofibroblast marker α-smooth muscle actin (α-SMA), the pan-leukocyte marker CD45 and picrosirius red (PSR) to visualise collagen fibres (collagen=red). Sections of the entire right caudal lobe (scale bar: 1 mm) with higher magnification views (×100 magnification; scale bar: 100 μm) are shown. c) Correlation matrix for qRISSc with histological parameters (percentage of α-SMA and CD45 positivity, and Ashcroft score), and mRNA expression of inflammatory (Il6 and Mcp1) and fibrotic (Col1a1, Col3a1 and Fn1) genes. A lower change in cycle threshold (ΔCt) value and thus negative correlation indicates higher gene expression. Spearman correlation coefficient ρ is shown. Nonsignificant associations are depicted on a white background. d) Volcano plot for qRISSc-correlated proteins. Proteins with ρ≥|0.3| and p<0.05 are highlighted in red. e) Bar plot of the top 10 (based on p-value) Gene Ontology biological processes associated with qRISSc. f) Bar plot of the top 10 (based on p-value) Reactome pathways associated with qRISSc. g) Heat plot indicating the top enriched proteins per molecular pathway. For (e–g), the most important associations are highlighted in purple. For pathway analyses, only proteins with ρ≥|0.3| and p<0.05 were considered. ER: endoplasmic reticulum; hnRNP: heterogeneous nuclear ribonucleoprotein.

