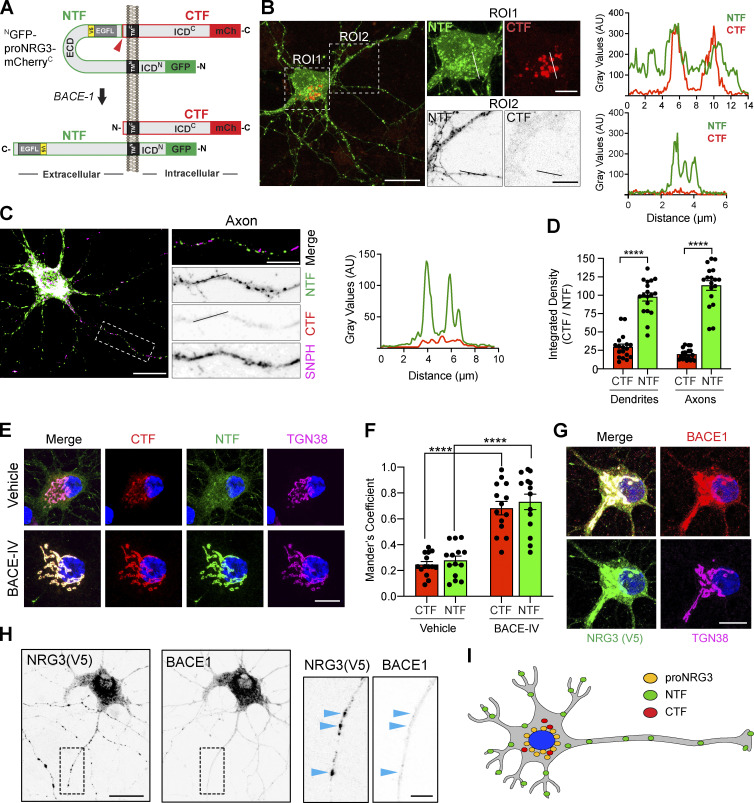
Figure 1.
NRG3 NTF is targeted to axons following BACE1-mediated processing. (A) Diagram illustrating the domain organization of NGFP-proNRG3-mCherryC used to analyze the subcellular distribution of proNRG3 (top) and processed NTF/CTF (bottom) following BACE1 cleavage. The NTF (green outline) encompasses a short cytoplasmic N-terminal sequence, the first transmembrane domain (TMN), the extracellular EGF-L domain that extends down to the BACE1 cleavage site (red arrowhead) in the juxtamembrane region upstream of TMC, as well as GFP at the N-terminus. The CTF (red outline) encompasses sequences downstream of the BACE1 cleavage site and includes mCherry (mCh) at the C-terminus. A V5-epitope–tagged variant lacking GFP/mCherry moieties (proNRG3/V5; epitope tag [yellow] located in the NTF upstream of the EGF-L domain) was used in some experiments. Domains are not drawn to scale. (B) Left: Representative image of a neuron transfected with NGFP-proNRG3-mCherryC showing overlapping GFP/mCh fluorescence in the soma (ROI1; see also corresponding line graph on right), but only GFP fluorescence in neurites (ROI2 and corresponding line graph), suggesting that processing occurs prior to NTF transport into neurites. (C) Representative overview image, magnified region of interest (ROI), and densitometric line scan of an axon from a neuron co-transfected with proNRG3/V5 and the axonal marker SNPH (pseudocolored magenta). Axons show NRG3 puncta positive for the V5-tagged NTF, but not for the CTF labeled with a C-terminal antibody. (D) Integrated fluorescence intensities for the NTF and CTF in SNPH− dendrites and SNPH+ axons. Data represent the mean ± SEM from 18 neurites (three independent experiments). (E) Representative images showing extensively overlapping NRG3 NTF and CTF signals in the TGN (identified with anti-TGN38) in a NGFP-proNRG3-mCherryC-transfected neuron treated with either vehicle or the BACE1 inhibitor BACE-IV (1 µM) for 24 h. (F) Quantitative analysis of experiment shown in E. Data are plotted as Mander’s overlap coefficients and represent the mean ± SEM from four independent experiments (n = 14 for all groups). (G and H) Subcellular distribution of BACE1 and NRG3 in a neuron co-expressing mCherry-tagged BACE1 and NRG3/V5 reveals overlap in the TGN (G) but not in neurites (H; arrowheads in magnified ROI). (I) Schematic illustration of the subcellular distribution of proNRG3, NRG3 NTF and NRG3 CTF. ****, P < 0.0001 (unpaired t test). Scale bars: B, C, and H, 20 μm; B (ROI1), E, and G, 10 μm; B (ROI2), C, and H (inset), 5 μm.

