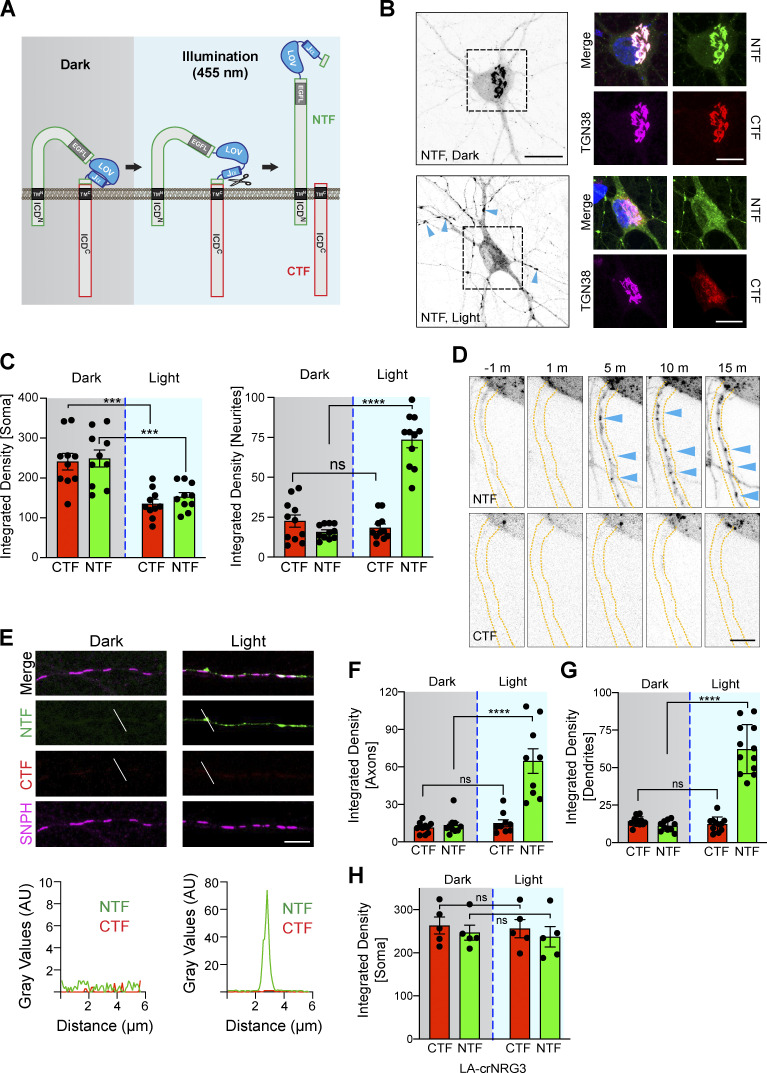
Figure 2.
Light-dependent processing of LA143-NRG3 and its trafficking to somato-dendritic compartments and axons. (A) Illustration of light-induced conformational changes in LA-NRG3 that enable BACE1 processing of proNRG3. (B) Representative postfixation images of neurons transfected with LA143-NRG3 before (dark, top) and 30 min after photoactivation (light, bottom); overview grayscale images on the left show the NRG3 NTF. GFP (NTF) and mCherry (CTF) fluorescence overlap extensively in the TGN (labeled with anti-TGN38) under dark conditions whereas photoactivation reduces both GFP and mCherry signals in the TGN and promotes the dispersal of the NTF throughout the neuron including in neurites (arrowheads). (C) Quantitative analysis of results shown in B. Bars represent integrated pixel densities for the NTF and CTF before (dark) and after (light) photoactivation in the soma (left) and neurites (right). Data represent the mean ± SEM of three independent experiments (n = 10–11 cells). (D) Time-lapse images illustrating the appearance of punctate NTF (arrowheads) but not CTF signals in a neurite 5 min after photoactivation. m, min. (E) Representative images (top) and densitometric line scans (bottom) of SNPH+ axons from neurons transfected with LA143-NRG3, illustrating the lack of both NTF and CTF before photoactivation (dark) and appearance of NTF but not CTF 3 h after photoactivation (light). Note that for this experiment, LA143-NRG3 was tagged with mCherry at the N-terminus; rabbit polyclonal anti-NRG3 against the ICDC was used after fixation to label the untagged CTF. Signals for NTF, CTF, and SNPH are pseudocolored respectively in green, red, and magenta to maintain consistency with other panels. (F and G) Quantification of pre- and postphotoactivation NTF/CTF fluorescence, showing increased NTF but not CTF signals in both axons (F) and dendrites (G) after photoactivation. Data are plotted as integrated pixel densities and represent the mean ± SEM from three independent experiments (n = 8–12 neurites). (H) Fluorescence intensities of NTF/CTF signals in the soma/TGN are unchanged after photoactivation in neurons expressing cleavage-resistant LA-crNRG3. Data represent the mean ± SEM from three independent experiments (n = 5 neurons). ****, P < 0.0001; ***, P < 0.001; ns, P > 0.05 (one-way ANOVA with Tukey’s post-hoc test). Scale bars: B (overview), 20 μm; B (ROIs), 10 μm; D and E, 5 µm.

