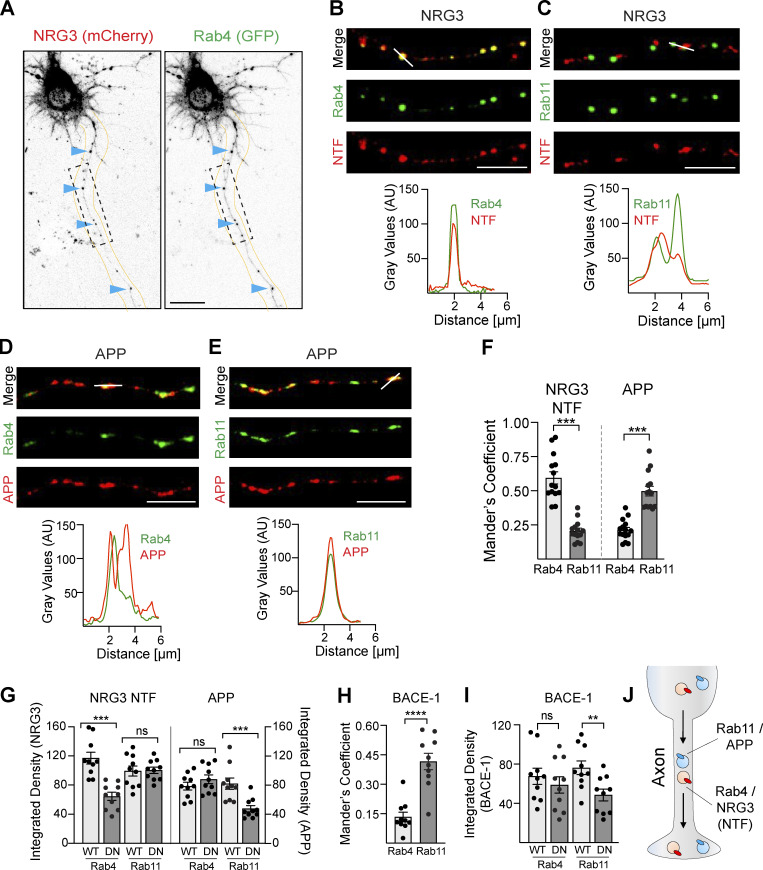
Figure 5.
Distinct axonal sorting of BACE1 substrates NRG3 and APP. (A) Representative grayscale images of a neuron transfected with mCherry-NRG3 and GFP-Rab4. Arrowheads point to examples of overlapping NRG3 (left) and Rab4 (right) axonal puncta. (B–E) Representative images (top) and corresponding densitometric line scans (bottom), illustrating the extent of co-localization of the NRG3 NTF with Rab4 (B corresponds to ROI shown in A) and Rab11 (C), and of APP (mCherry) with Rab4 (D) and Rab11 (E). Images were taken 16 h after transfection. (F) Quantitative analysis of NRG3 and APP colocalization with Rab4+/Rab11+ trafficking vesicles in axons that illustrate preferential NRG3 trafficking in Rab4+ vesicles vs. APP trafficking in Rab11+ vesicles. Data are plotted as Mander’s overlap coefficients and represent the mean ± SEM of three independent experiments (n = 14 ROIs). (G) The role of Rab4 and Rab11 GTPase activity in vesicular trafficking of NRG3 and APP was explored in neurons transfected with mCherry-tagged NRG3 or APP and either WT or DN variants of GFP Rab4 and GFP Rab11. Integrated NRG3 NTF pixel density was reduced in axons expressing DN-Rab4 relative to axons expressing WT Rab4. Data represent the mean ± SEM from three independent experiments (n = 10 ROIs). (H) mCherry-tagged BACE1 co-localizes preferentially with GFP-tagged Rab11 in neurons imaged 12–16 h following transfection. Data are plotted as Mander’s overlap coefficients and represent the mean ± SEM of three independent experiments (n = 10 ROIs). (I) DN-Rab11, but not DN-Rab4, significantly reduces axonal trafficking of BACE1. Data are plotted as integrated pixel densities and represent the mean ± SEM of three independent experiments (n = 10 ROIs). (J) Schematic illustration of preferential anterograde trafficking of the NRG3 NTF on Rab4+ transport vesicles and of APP on Rab11+ transport vesicles. ****, P < 0.0001; ***, P < 0.001; **, P < 0.01; ns, P > 0.05 (unpaired t test). Scale bars: A, 20 μm; B, C, D, and E, 5 μm.

