Figure S2.
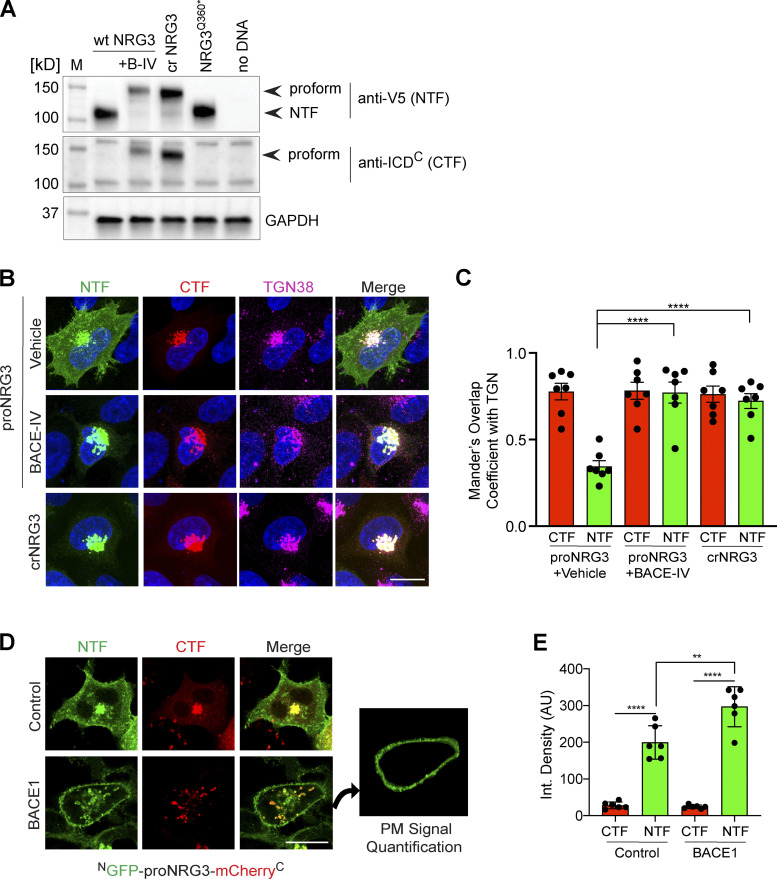
BACE1 cleaves proNRG3 in the TGN of transfected HEK293 cells. (A) Western blot analysis of cells co-transfected with BACE1-mCherry and either proNRG3/V5, crNRG3/V5 or truncated NRG3(Q360*)/V5 (resembling the NTF following BACE cleavage of proNRG3) using anti-V5 for the NTF and anti-NRG3 ICDC antibody for the CTF. Note that BACE1 inhibition with BACE-IV (B-IV; 1 µM for 24 h) blocks generation of the NRG3 NTF in cells expressing proNRG3, and that the NRG3 NTF is absent from cells expressing crNRG3/V5. (B) Cells transfected with proNRG3/V5 and treated with vehicle (DMSO, top) show widespread V5 immunoreactivity indicative of processed NRG3 NTF throughout the cell body in addition to the TGN (labeled with anti-TGN38) while the CTF is detected exclusively in the TGN, indicative of unprocessed proNRG3. By contrast, cells transfected with proNRG3/V5 and treated with 1 µM BACE-IV for 24 h (middle), as well as cells transfected with crNRG3/V5 (bottom), show extensive overlap of NTF and CTF signals in the TGN and low NTF signals elsewhere. (C) Quantitative analysis of results shown in B. Data plotted as Mander’s coefficients for CTF/NTF with TGN38, representing the mean ± SEM from three independent experiments (n = 7 cells). (D) Representative images of HEK293 cells co-transfected with NGFP-proNRG3-mCherryC and an empty vector (top) or a vector expressing BACE1 (bottom). The panel additionally illustrates how PM signals were quantified via isolation of the peripheral signal (right). Of note, single frames were used for this analysis to minimize the contribution of intracellular compartments. (E) Quantitative analysis of results shown in D. Increased PM signals for the NTF (but not the CTF) in cells co-transfected with BACE1 suggest augmented proNRG3 processing. Data are plotted as integrated pixel density and represent the mean ± SEM from three independent experiments (n = 6 cells). **, P < 0.01; ****, P < 0.0001 (C, nonparametric t test; E, one-way ANOVA). Scale bars: 10 μm. Source data are available for this figure: SourceData FS2.

