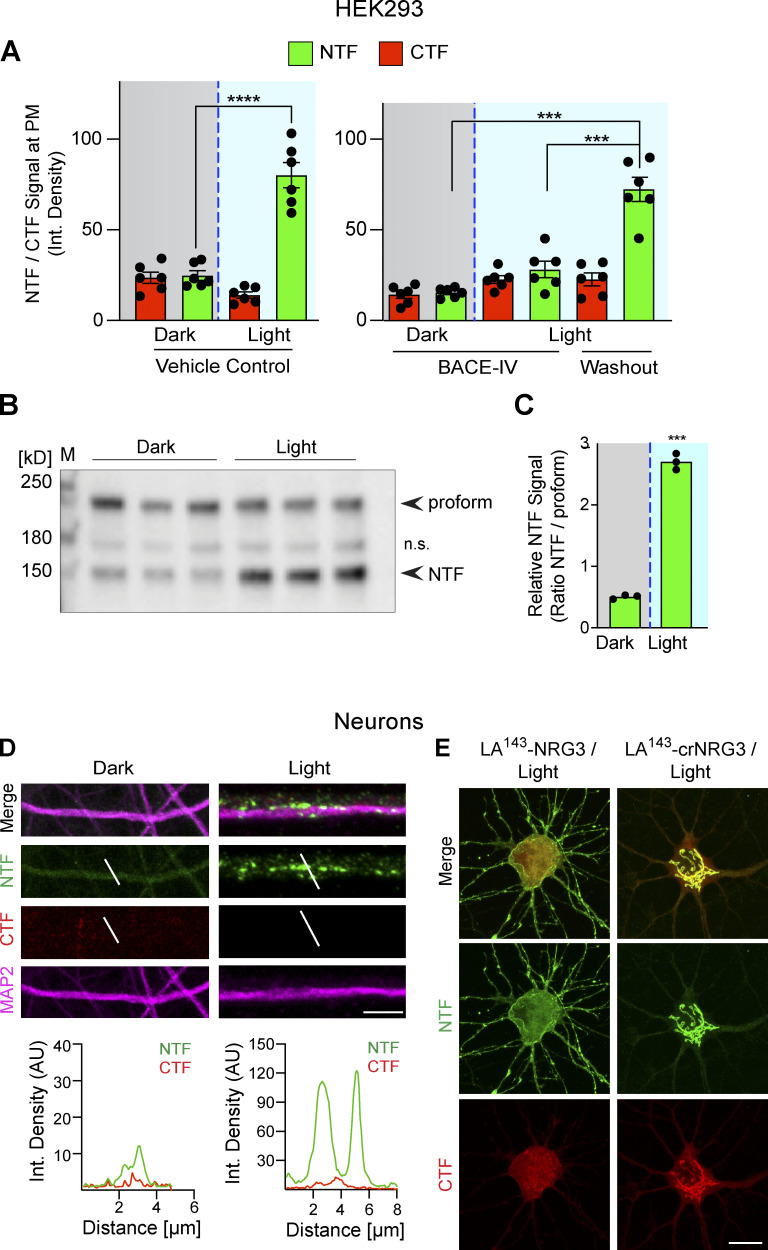
Figure S4.
Photoactivation triggers LA143-NRG3 processing and accumulation of its NTF in dendrites. (A) BACE1-dependent translocation of the NRG3 NTF from the TGN to the PM following photoactivation. Data are plotted as integrated NTF/CTF pixel densities at the PM before (gray background) and after (blue background) photoactivation in HEK293 cells pre-treated for 24 h with vehicle (left) or 1 μM BACE-IV (right). Note the increase in PM signal following drug washout. Data represent the mean ± SEM of n = 6–8 cells from three independent experiments. (B) Blue-light illumination increases NTF signal levels in HEK293 cells, thus demonstrating that LA143-NRG3 is processed upon photoactivation. Western blot results are from three independent experiments. (C) Densitometric analysis of results shown in B; data are plotted as ratios of NTF over unprocessed LA143-NRG3 signals. (D) Neurons were transfected with LA143-NRG3 and imaged without (Dark) or following (Light) photoactivation. Representative post-fixation images (top) and corresponding line scan densitometry (bottom) illustrate the lack of NTF/CTF signals under dark conditions, and the appearance of NTF but not CTF signals upon photoactivation in MAP2+ dendrites. (E) Neurons were transfected with WT or noncleavable LA143-NRG3 (LA143-crNRG3) and photoactivated. Representative images illustrate how for WT LA143-NRG3, the NTF distributes broadly throughout the neuron cell body and neurites while the CTF remained in the cell body. By contrast, LA143-crNRG3 remained confined to the cell body (presumably in the TGN). Data represent the mean ± SEM from three independent experiments. Scale bars: D, 10 μm; E, 8 μm. ****, P < 0.0001; ***, P < 0.001 (A, one-way ANOVA; C, non-parametric t test). Source data are available for this figure: SourceData FS4.

