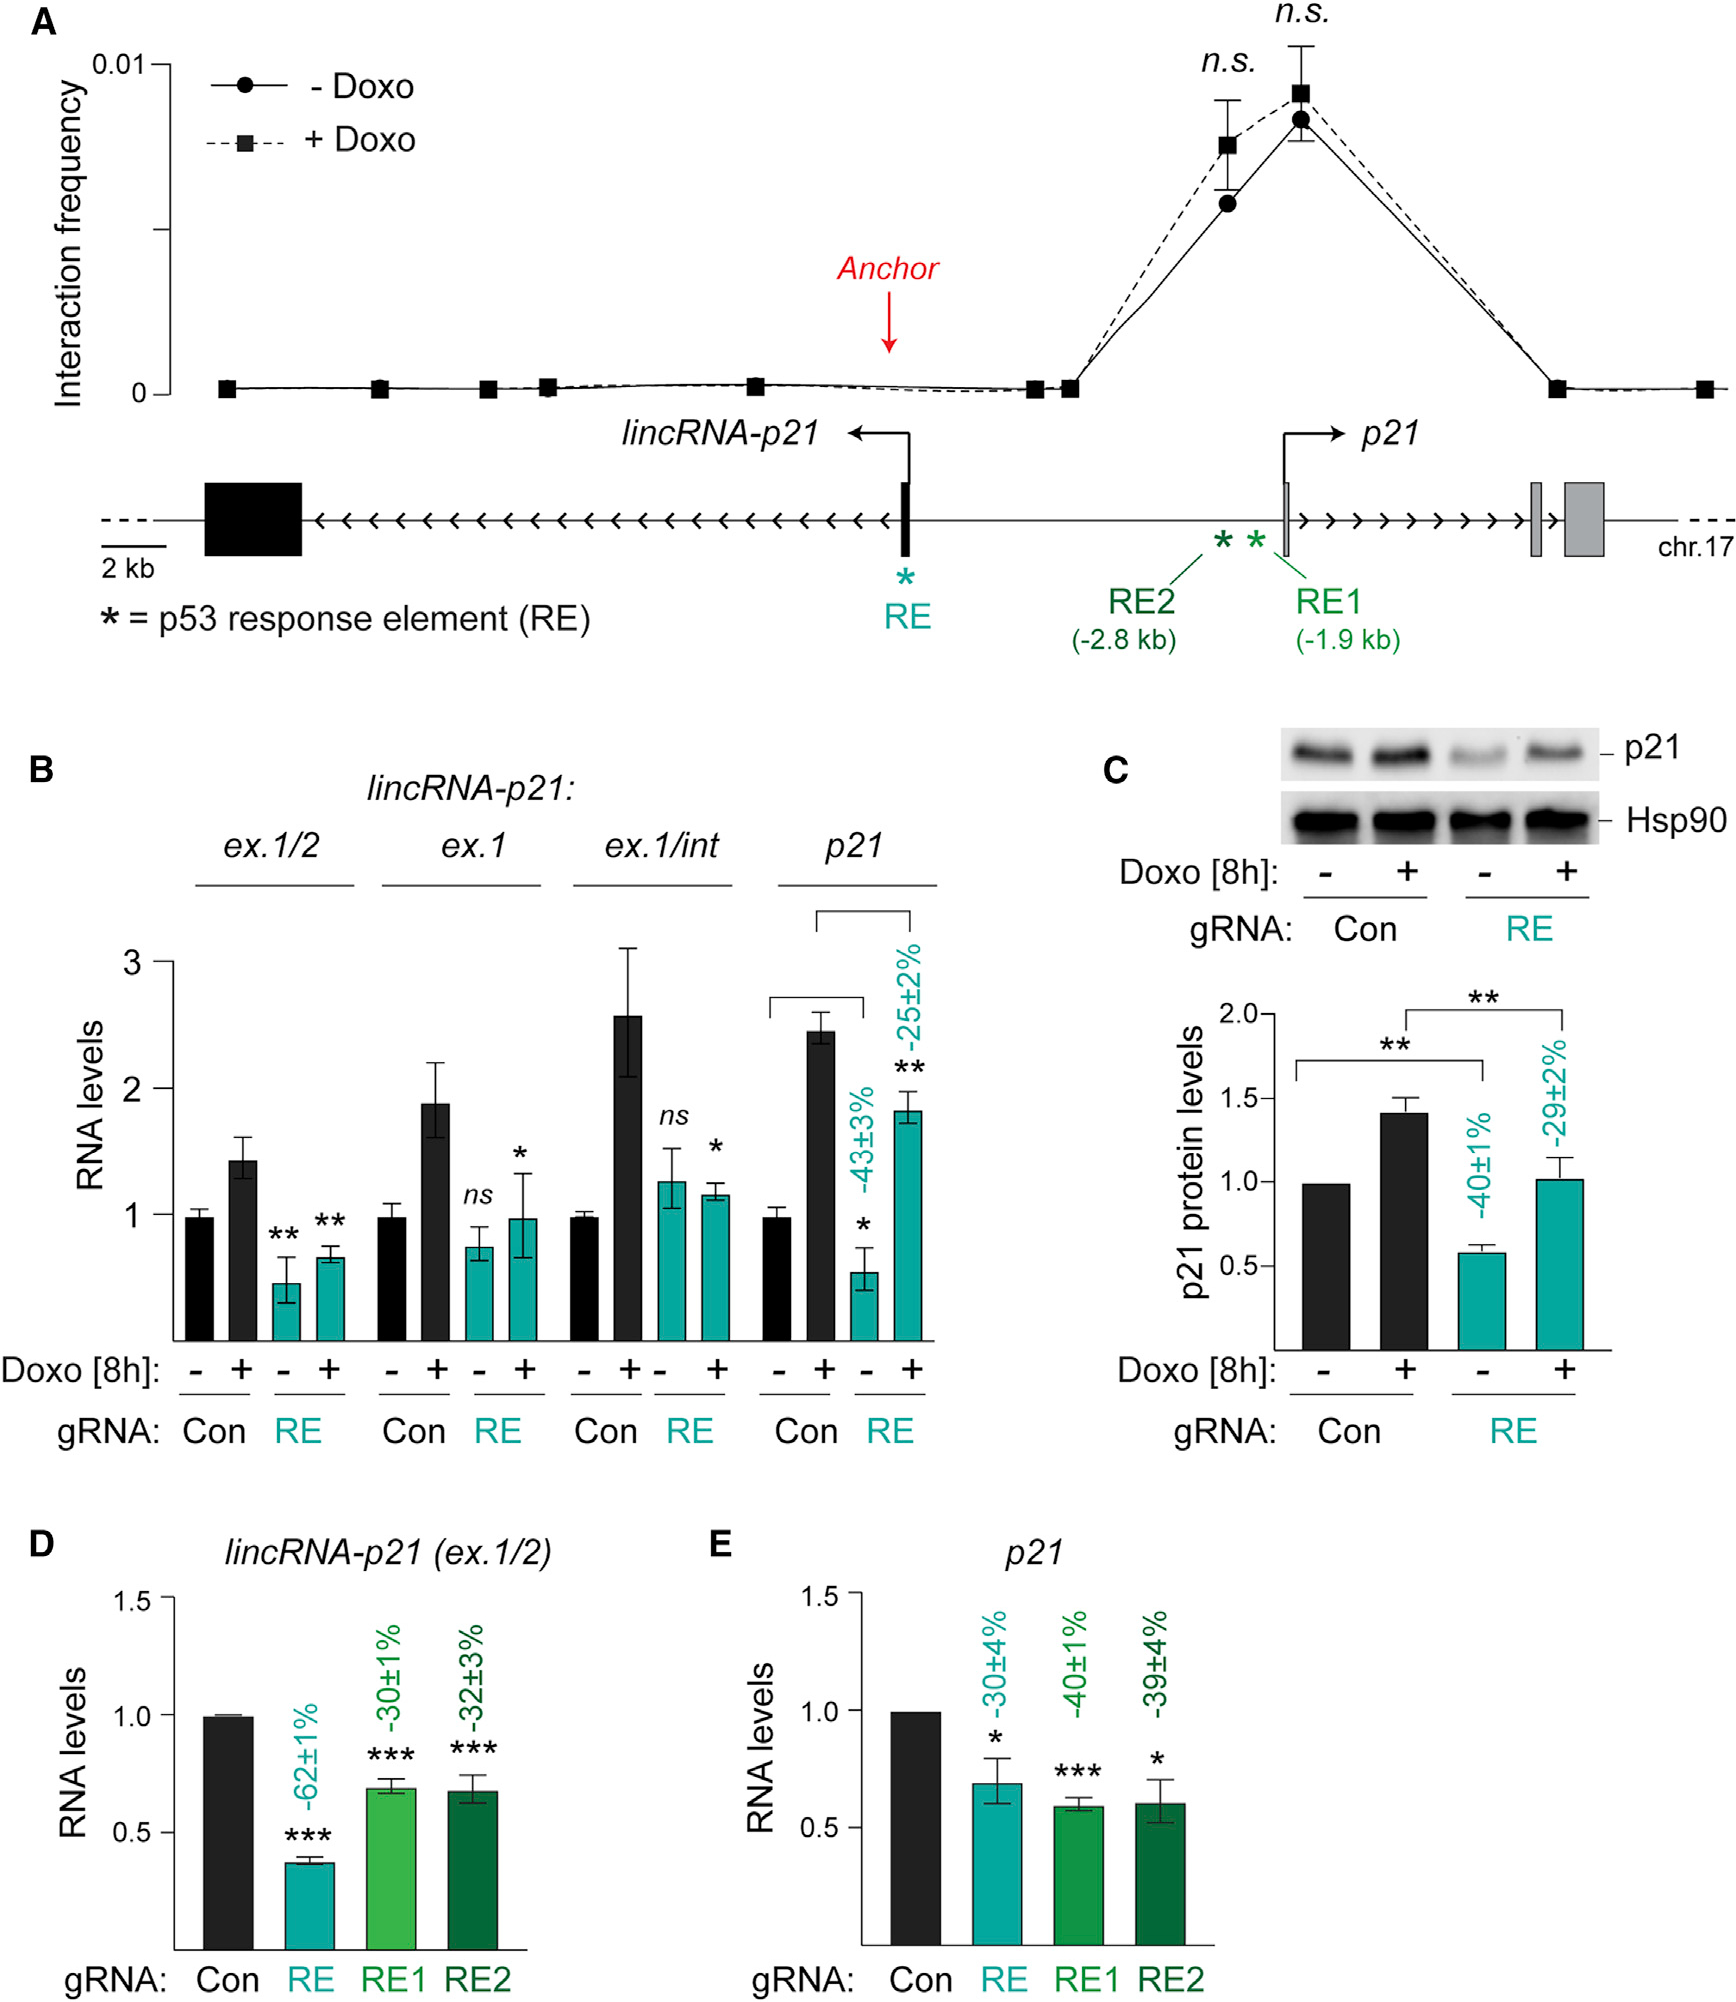
Figure 1. Reciprocal regulation of lincRNA-p21 and p21 by proximal and distal p53 response elements.

(A) Top, 3C analysis showing interaction frequency relative to genomic position, n = 3; Bottom, schematic of the lincRNA-p21/p21 locus highlighting the locations of the p53REs (*) and 3C anchor position (red arrow).
(B) qRT-PCR of normalized spliced (ex.1/2) and nascent (ex.1 and ex.1/int) lincRNA-p21 and p21 levels in RNA from wild-type MEFs with indicated treatments, n = 9.
(C) Top, representative immunoblot of p21 protein levels in whole cell lysates from MEFs in (B). Hsp90, loading control. Bottom, quantification of normalized p21 protein levels, n = 3.
(D and E) qRT-PCR of normalized lincRNA-p21 (D) and p21 (E) levels in RNA from MEFs, expressing Con or p53RE-targeting gRNAs, n = 3.
Data are represented as mean ± SEM of indicated biological replicates. Numbers indicate the percentage change relative to control samples with corresponding treatment; n.s. not significant, **p < 0.01, ***p < 0.001; paired t test.
