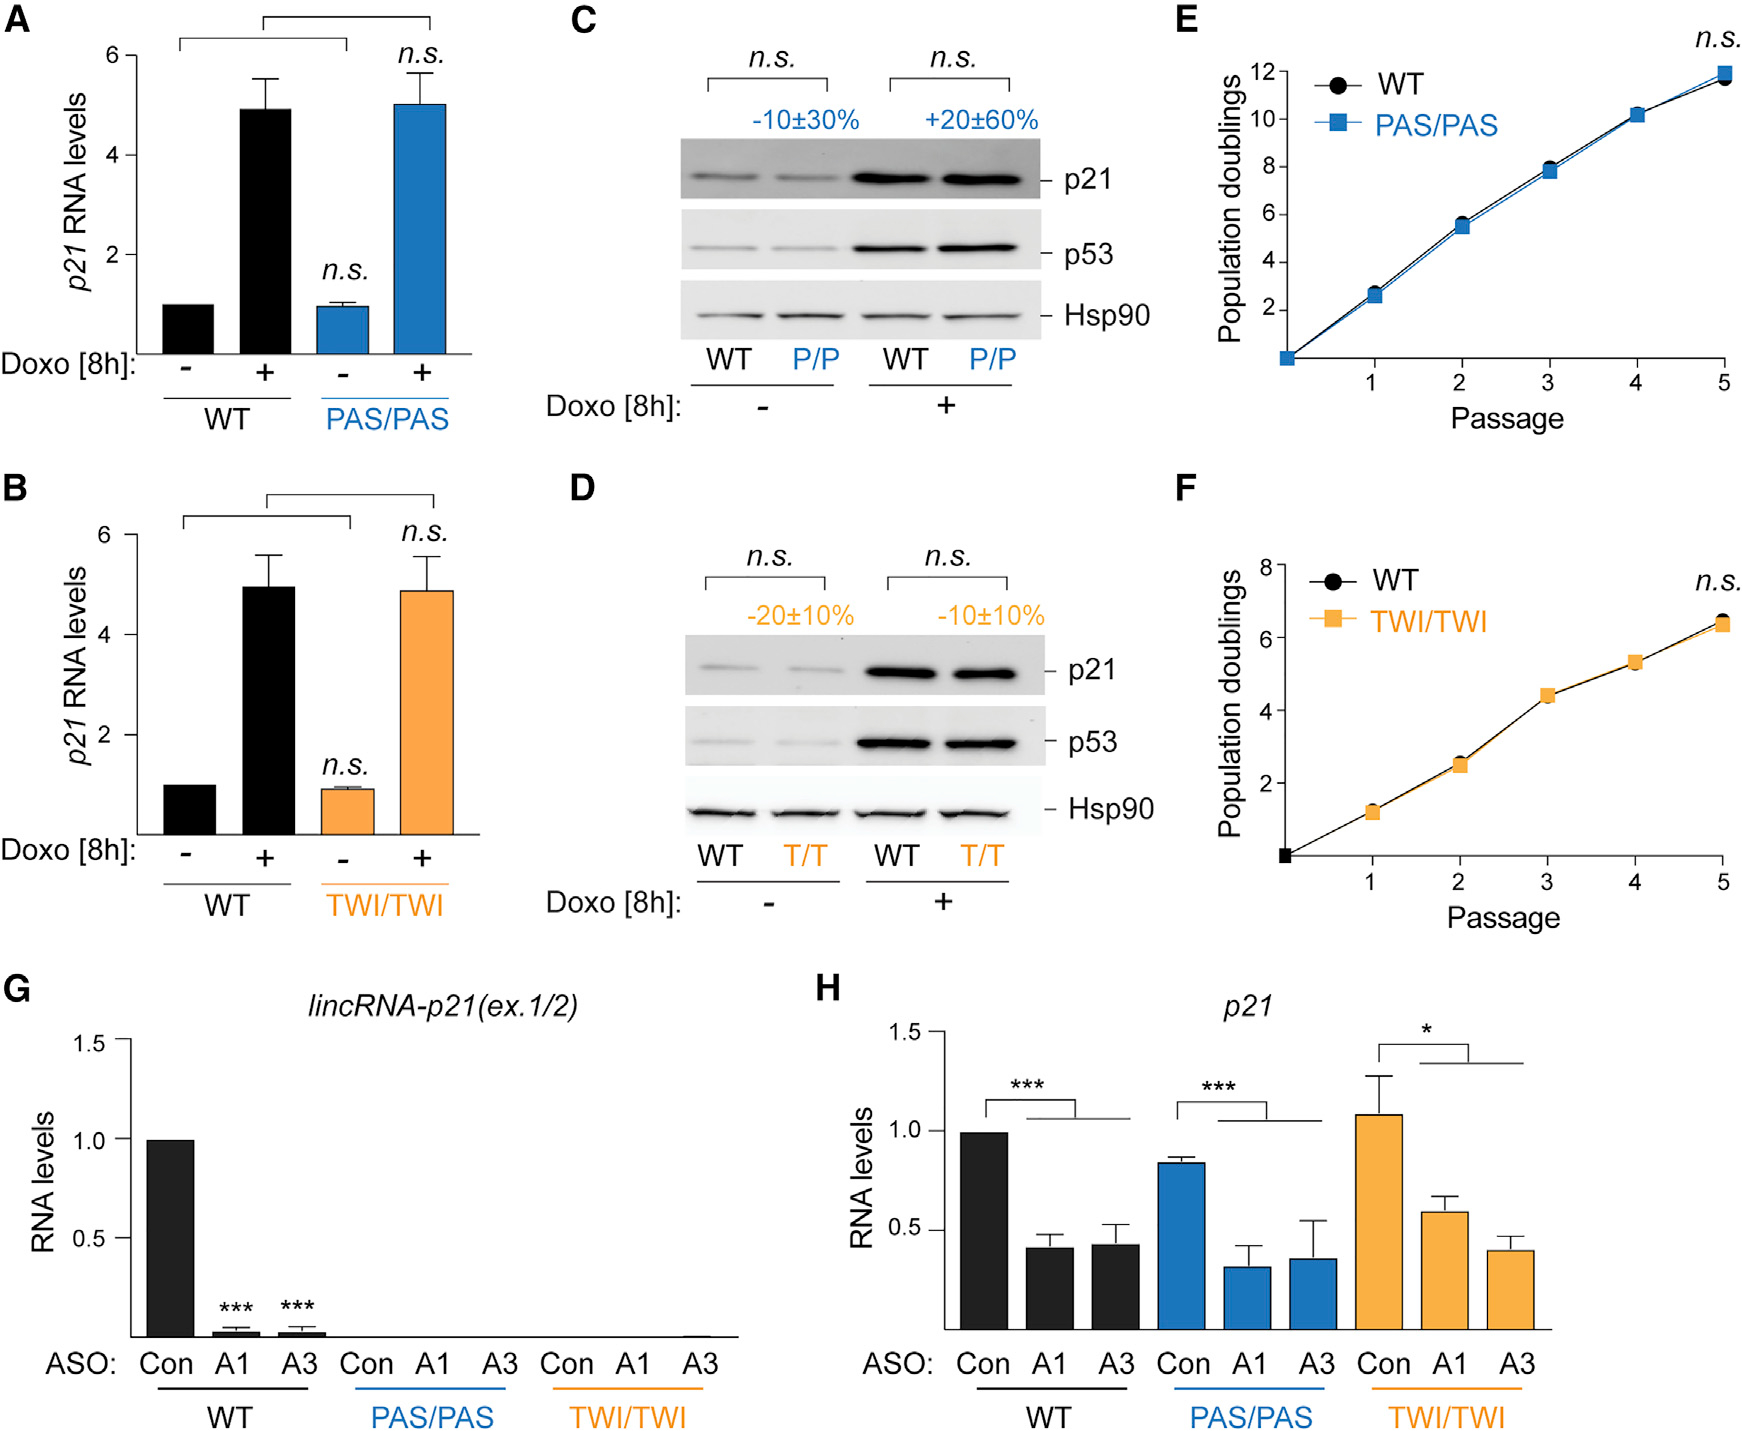
Figure 3. lincRNA-p21 transcription and accumulation are dispensable for p21 regulation.

(A and B) qRT-PCR of normalized p21 levels in RNA from indicated MEFs, n = 12 (A); n = 7 (B).
(C and D) Representative immunoblot images of p21 and p53 protein levelsin whole cell lysates fromMEFs in (A) and (B); Hsp90, loading control.n = 7 (C) and n = 8 (D).
(E and F) Growth curve showing population doublings of indicated MEFs over passages, n = 3.
(G and H) qRT-PCR of normalized lincRNA-p21 (H) and p21 (I) levels in RNA from indicated MEFs transfected with control (Con) or lincRNA-p21-targeting ASOs (ASO1 and ASO3), n = 3.
Data are represented as mean ± SEM of indicated biological replicates; n.s. not significant, *p < 0.05, **p < 0.01, ***p < 0.001; paired t test. Numbers indicate percentage change relative to controls with corresponding treatment.
