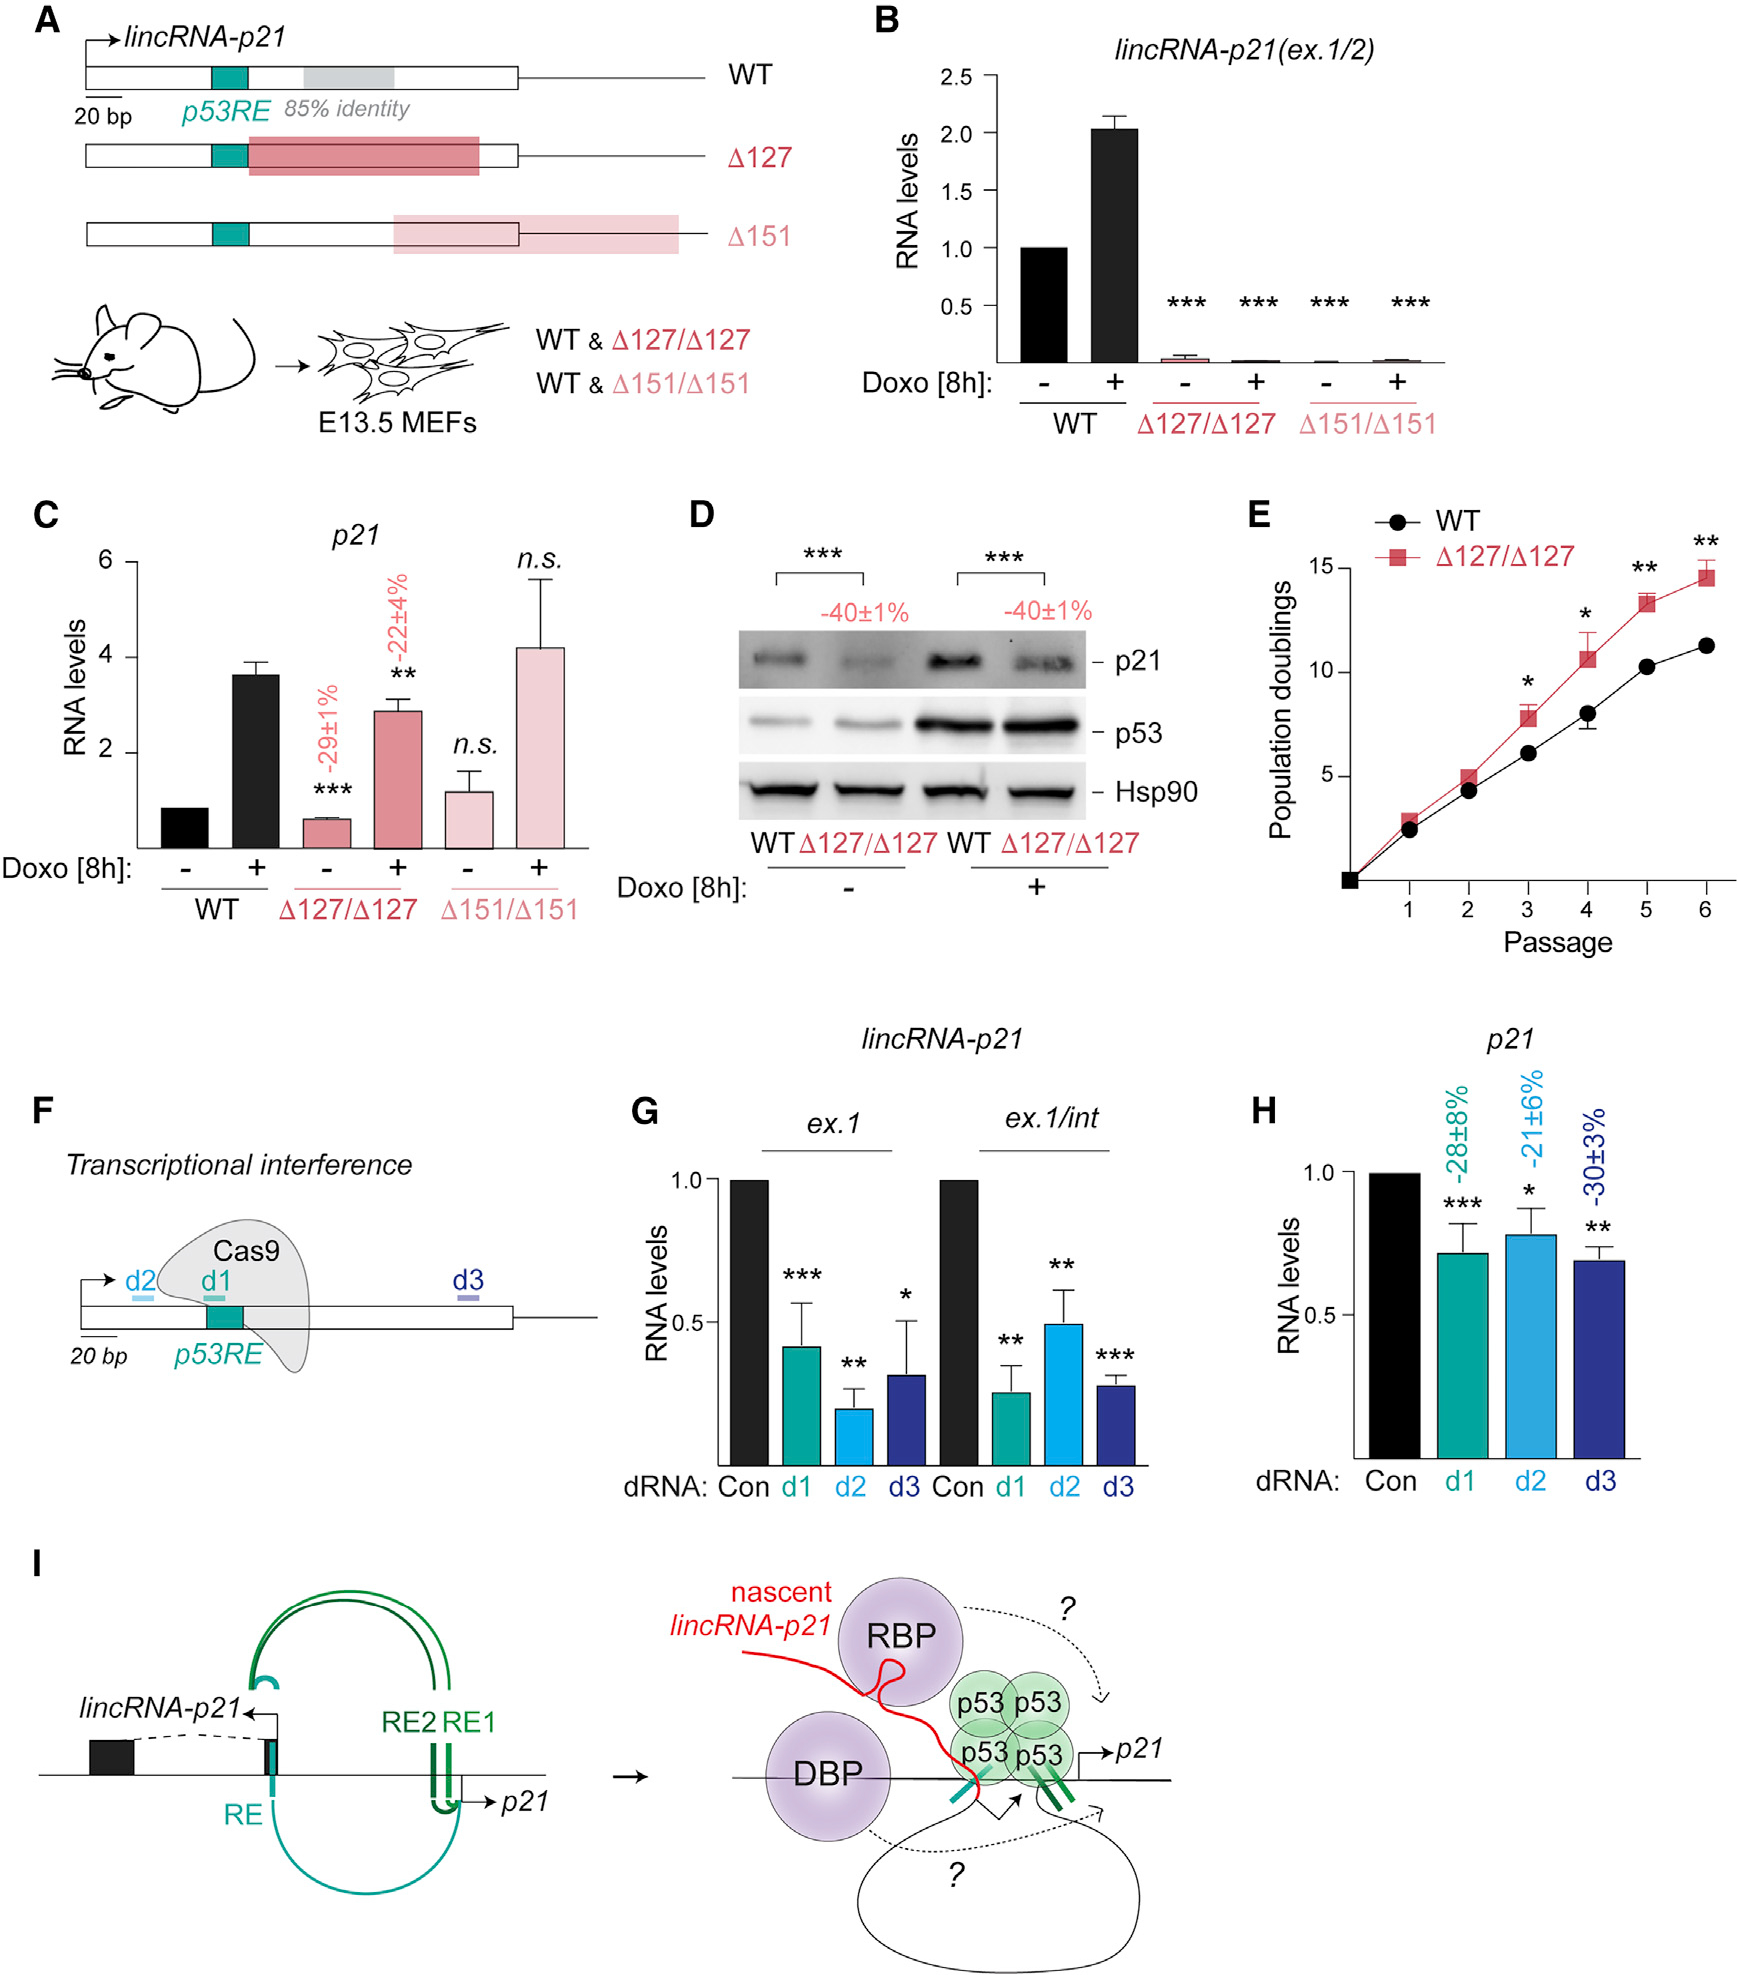
Figure 4. Nascent transcription of lincRNA-p21 promotes p21 expression.

(A) Top, schematic highlighting the regions of D127 (red) and D151 (light red) deletions in lincRNA-p21. Bottom, littermate mutant and wild-type (WT) MEFs were isolated at E13.5.
(B and C) qRT-PCR of normalized lincRNA-p21 (B) and p21 (C) levels in RNA from indicated MEFs, n = 3–8.
(D) Representative immunoblot image of p21 and p53 protein levels in whole cell lysates from MEFs in (C); Hsp90, loading control; n = 6.
(E) Growth curve showing population doublings of indicated MEFs over passages, n = 3.
(F) Schematic showing the location of dRNAs for transcriptional interference.
(G and H) qRT-PCR of normalized nascent lincRNA-p21 (G) and p21 (H) RNA levels in total DNAse-treated RNA isolated from WT MEFs expressing indicated dRNAs.
(I) Left, model depicting the cooperative regulation of lincRNA-p21 and p21 expression by proximal and distal p53REs. Right, models for the proposed contribution of nascent lincRNA-p21 in the recruitment of RNA-binding proteins (RBP) or DNA-binding proteins (DBP), which may directly regulate p21 expression due to looped chromatin architecture of the lincRNA-p21/p21 locus.
Data are represented as mean ± SEM of indicated biological replicates; n.s. not significant, *p < 0.05, **p < 0.01, ***p < 0.001, n = 3, paired t test. Numbers indicate the percentage change relative to controls with corresponding treatment.
