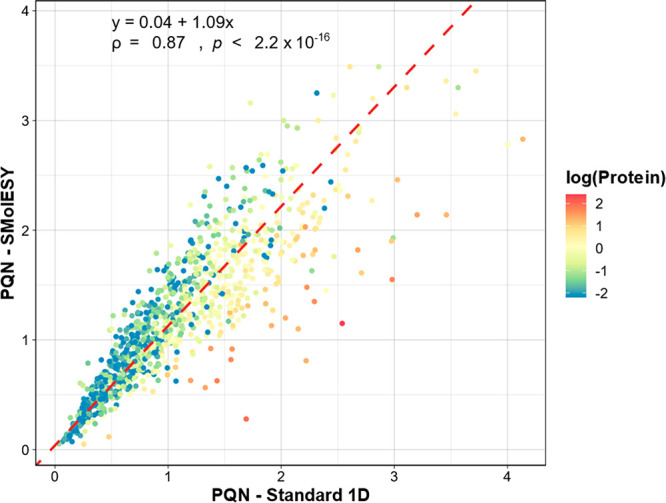
Figure 3.

Agreement between PQN coefficients estimated from the standard 1H NMR spectra and the corresponding SMolESY processed data. The linear regression trendline (dashed red line) was estimated with the orthogonal least-squares Passing–Bablok method. The regression coefficients, Pearson correlation coefficient (ρ) and the p-value from the two-sided correlation significance test are shown in the top left corner. Data points are colored by the natural logarithm of the estimated protein concentration (mg/mL).
