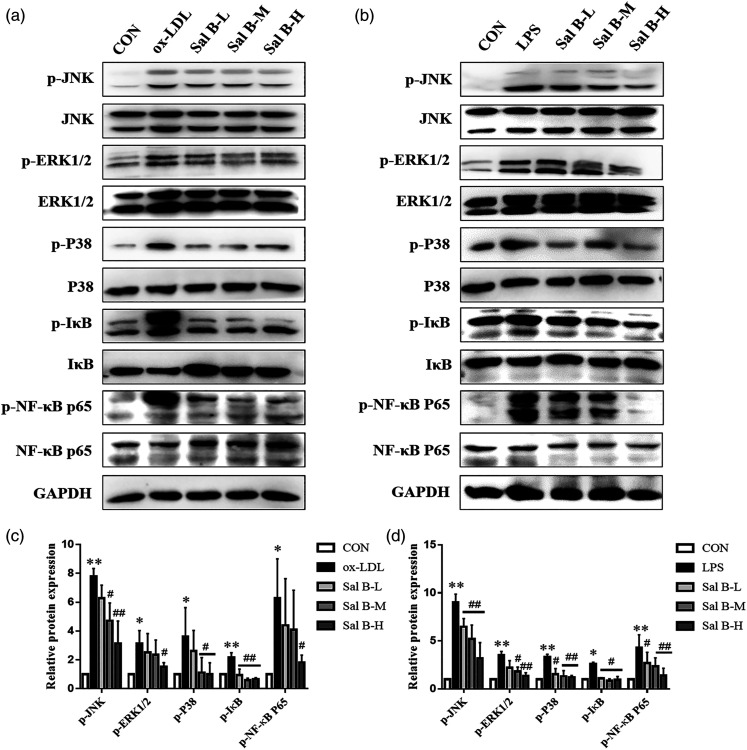
Figure 6.
Effect of Sal B on MAPKs/NF-κB pathway expression in RAW264.7 cells. (a) Protein was extracted from RAW264.7 cells induced by ox-LDL. (b) Protein was extracted from RAW264.7 cells induced by LPS. Then the total and phosphorylated levels of JNK, ERK1/2, p38, IκB, and NF-κB were determined by Western Blotting assay. (c)–(d) The quantitative results were calculated, respectively, by ImageJ analysis software, n = 3. CON, control group; ox-LDL, ox-LDL-stimulated group; LPS, LPS-stimulated group; Sal B-L, Sal B at 1.25 μg/ml concentration; Sal B-M, Sal B at 2.5 μg/ml concentration; Sal B-H, Sal B at 5 μg/ml concentration. Data are expressed as mean ± SD. *p < 0.05, **p < 0.01 vs CON group; #p < 0.05, ##p < 0.01 vs ox-LDL group or LPS group.

