Figure 3.
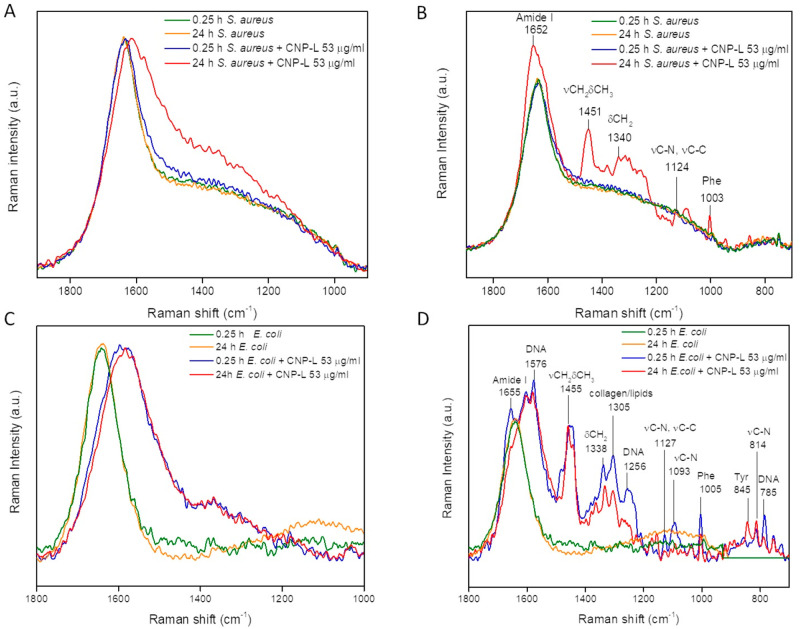
DEP–Raman analysis of the interaction of CNP-L with S. aureus and E. coli. DEP–Raman spectra of (A, B) S. aureus SH1000 and (C, D) E. coli MG1655 in the absence or presence of CNP-L (53 μg/mL) after 0.25 and 24 h of incubation. For each bacterial strain two different signals were recorded, focalizing the Raman microscope in regions of the same sample in which the ECM was (B, D) or was not (A, C) present. Each line represents the normalized average of three Raman spectra recorded during three independent experiments.

