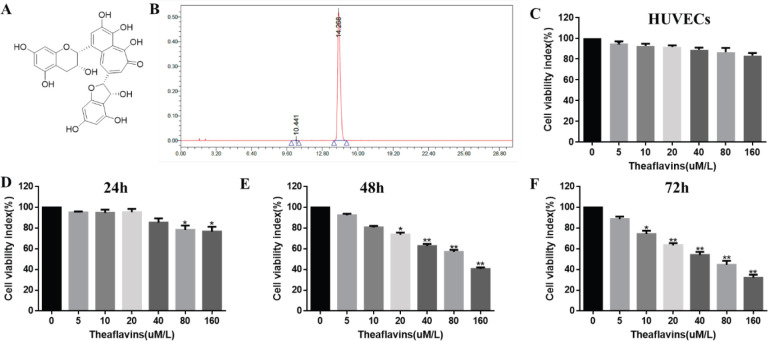
Figure 1.
Effect of theaflavin (TF) on the viability of CNE2 cells. (A) Structure of TF. (B) Chromatogram of TF detected by high-performance liquid chromatography (HPLC). (C, D, E, F) Cell viability was tested by the CCK-8 assay method. (C) Effect of TF on normal cells (HUVECs) for 72 hr, (D-F) Effect of TF on CNE2 cells. The data are presented as the mean ± SD from three independent experiments. *P<0.05, **P<0.01, compared with the control group

