Fig. 2.

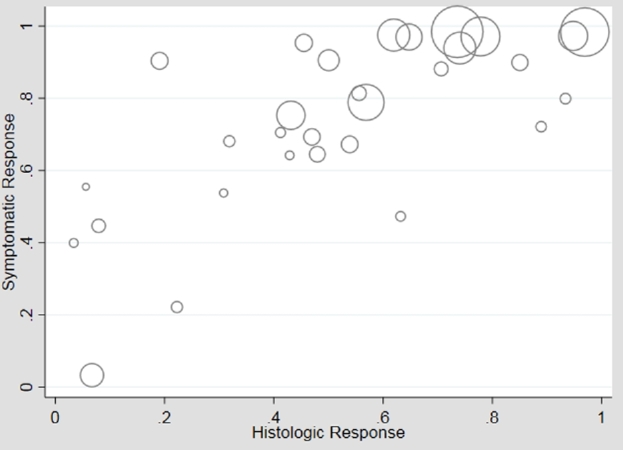
Plot of histologic versus symptomatic response, unstratified analysis of all studies. Meta-regression found moderate association (β1 = 0.64, P < 0.01; β0 = 0.41, P < 0.01), but considerable heterogeneity (I2 = 89%).

Plot of histologic versus symptomatic response, unstratified analysis of all studies. Meta-regression found moderate association (β1 = 0.64, P < 0.01; β0 = 0.41, P < 0.01), but considerable heterogeneity (I2 = 89%).