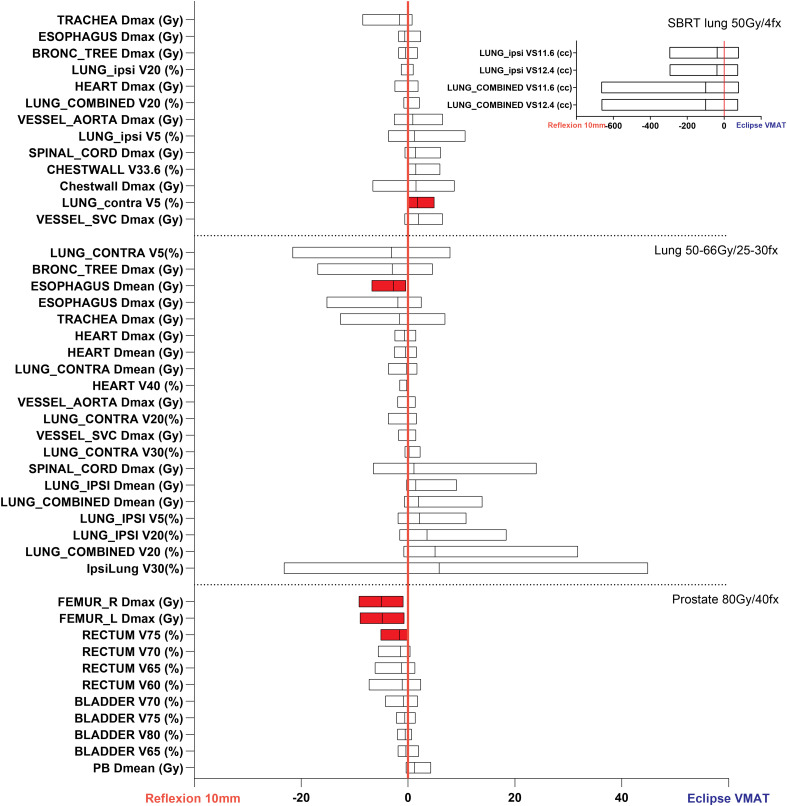
Figure 2.
Differences in achieved plan quality metrics between the X1-10mm and Eclipse VMAT plans for lung SBRT, lung, and prostate treatment sites. Parameters plotted in the left part of the graph show X1-10mm plan superiority. Red shading denotes statistically significant differences. The differences in PTV coverage and plan heterogeneity were not statistically significant for these treatment sites. Due to the large differences in ipsilateral and combined lung VS11.6Gy and VS12.4Gy, these metrics are shown in a separate inset plot for the lung SBRT site.

