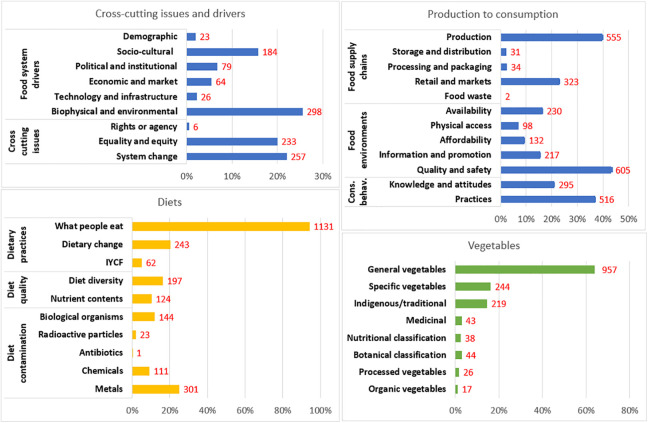
Figure 7.
Overview of mapping results across food systems, diets, and vegetables. For each of the charts throughout the article, the bars show the percentage of these 1383 articles that cover a particular topic or use a particular method, and the numbers at the ends of the bars show the number of articles. Note that not all totals will add up to 1383 or 100%, as many articles look at multiple issues or locations.

