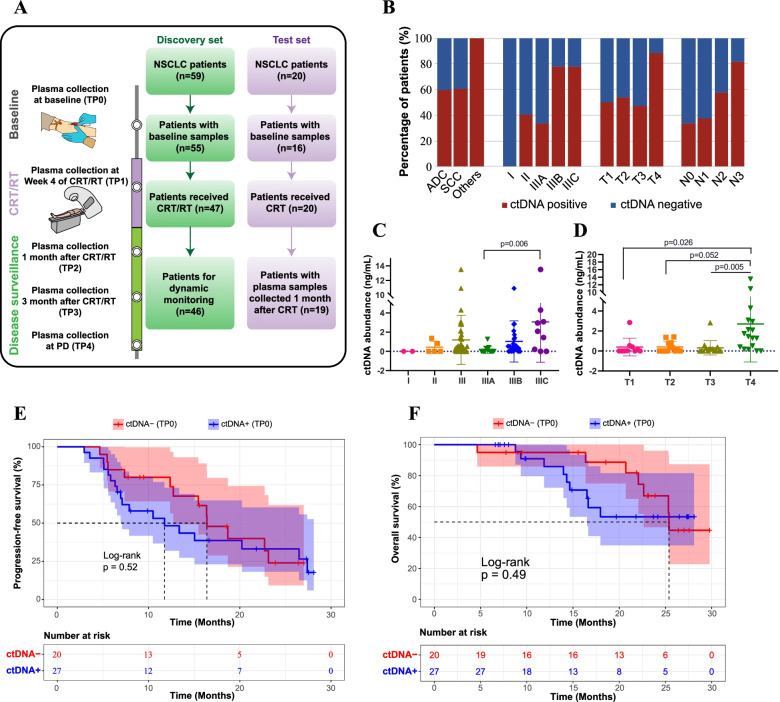
Fig. 1.
Baseline ctDNA status correlated with disease stage but not patient prognosis. A The workflow of the study. Specifically, TP0 plasma samples were collected before any treatments, TP1 plasma samples were collected in the middle of CRT/RT treatment (i.e., in the fourth week during CRT/RT), and other plasma samples were collected after CRT/RT treatment (i.e., TP2 for 1 month after CRT/RT, TP3 for 3 months after CRT/RT, and TP4 for the progressive disease after CRT/RT). B The relationship between baseline ctDNA status and TNM stage in NSCLC patients (n = 55). C-D The relationship between ctDNA abundance and disease stage (C) or T stage (D) in NSCLC patients (n = 55). Data are presented as the median +/− 2*IQR (interquartile range). The Bonferroni method was used for multiple comparison correction. E-F Kaplan-Meier curve of progression-free survival (E) or overall survival (F) stratified by baseline ctDNA status for patients in the discovery set

