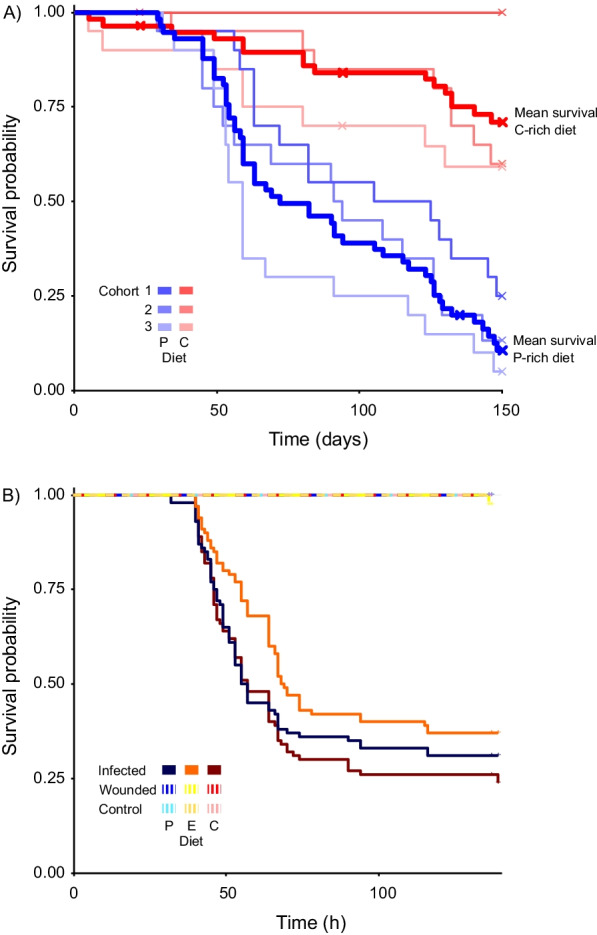
Fig. 2.

Kaplan–Meier survival curves of: A Unmanipulated B. orientalis males restricted to P-rich (35% protein and 7% carbohydrate) or C-rich (7% protein and 35% carbohydrate) diets. Survival data for three independent cohorts (1–3) for P- and C-rich diets are given in blue and red respectively, with mean population survival across cohorts on each diet indicated by a thick bold line. Note the long period at the beginning of the experiment where no clear survival differences between diets are observable. B B. orientalis males restricted to P-rich (35% protein and 7% carbohydrate) (blue line), C-rich (7% protein and 35% carbohydrate) (red line, or E (21% protein and 21% carbohydrate) (yellow line) diet following injection with an LD50 of P. entomophila (infected), Ringer’s solution (wounded) or unmanipulated (control)
