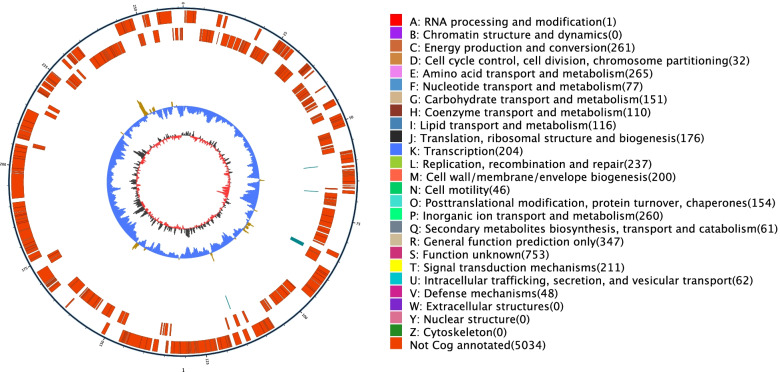
Fig. 4.
Schematic of the complete genome of P. stutzeri S116 isolated from marine activated sludge samples. The first circle (outermost) indicates genomic numbers, with each tick representing 5 kb; genes on forward and reverse chains with different colors based on COG categories are represented at the second and third circles; repetitive sequences (fourth circle); tRNA with bule and rRNA with purple (fifth circle); GC skew (sixth circle). The lightly yellow region indicates that the GC content is higher than the average in the genome; nevertheless, the bule region represents the opposite. The dark gray region represents G content greater than C, and the red region represents C content greater than G

