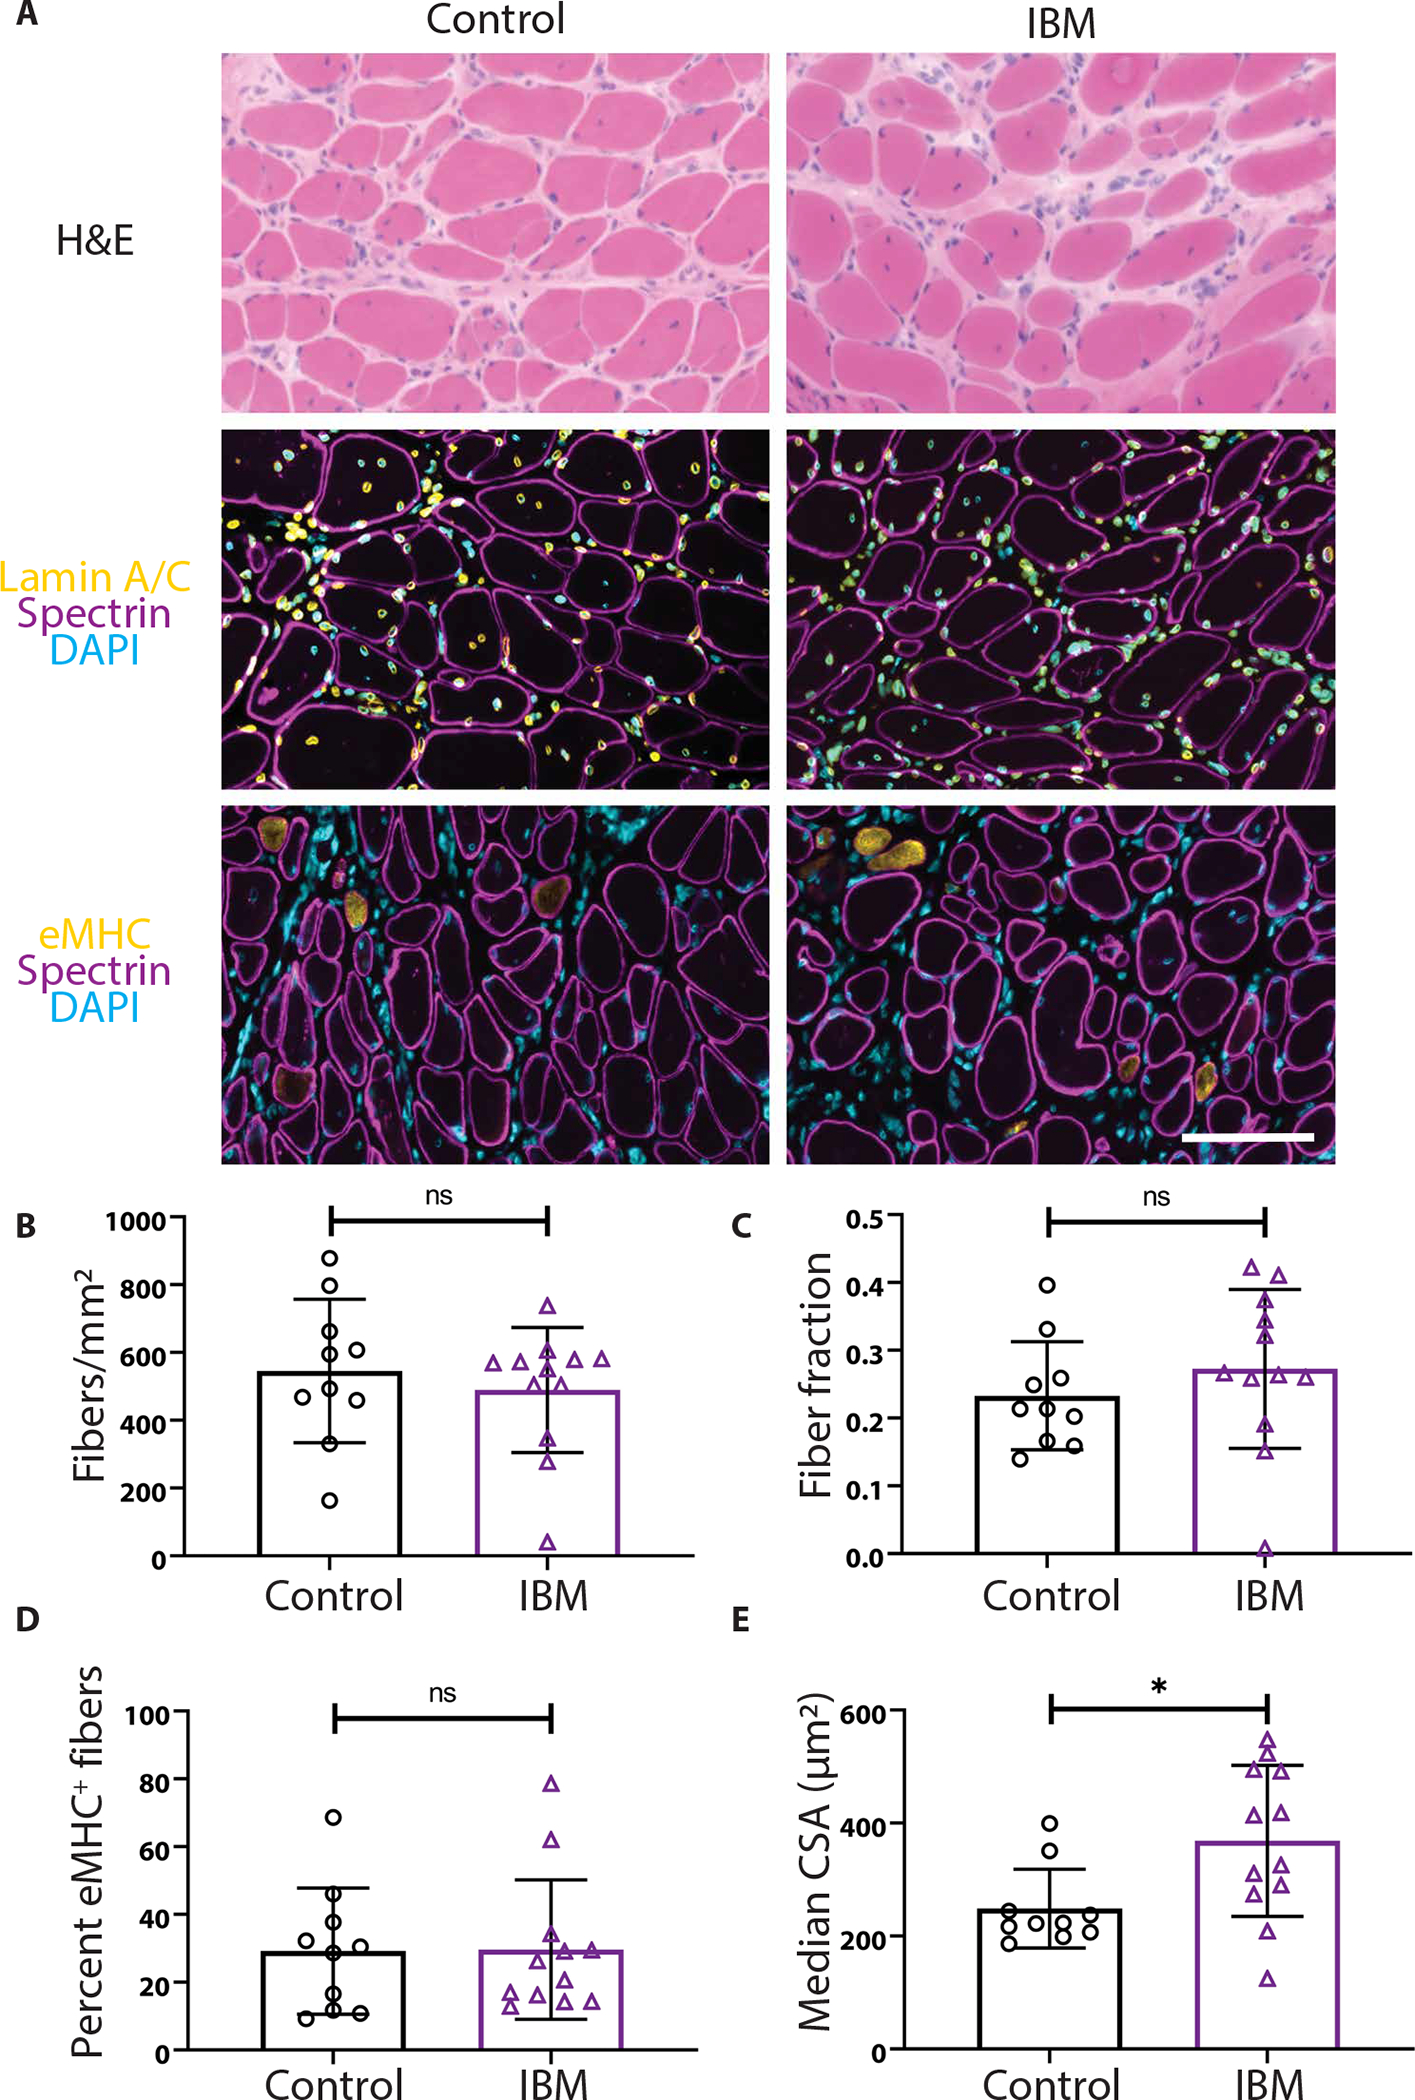
Fig. 2. IBM xenografts regenerate robustly in NRG mice.

(A) Representative images of 4-month control and IBM xenografts stained with hematoxylin and eosin (H&E), human spectrin (magenta), human lamin A/C (yellow), embryonic myosin heavy chain (eMHC) (yellow), and 4′,6-diamidino-2-phenylindole (DAPI) (cyan). Scale bar, 100 μm. (B to D) The number of fibers per xenograft area (B), the fraction of the xenograft covered by myofibers (C), and the percentage of eMHC+ regenerating fibers are similar between control and IBM xenografts (D). (E) The median cross-sectional area (CSA) of myofibers within the xenografts (*P < 0.05, Mann-Whitney test). For all graphs, each point denotes one subject (control, n = 10; IBM, n = 12).
