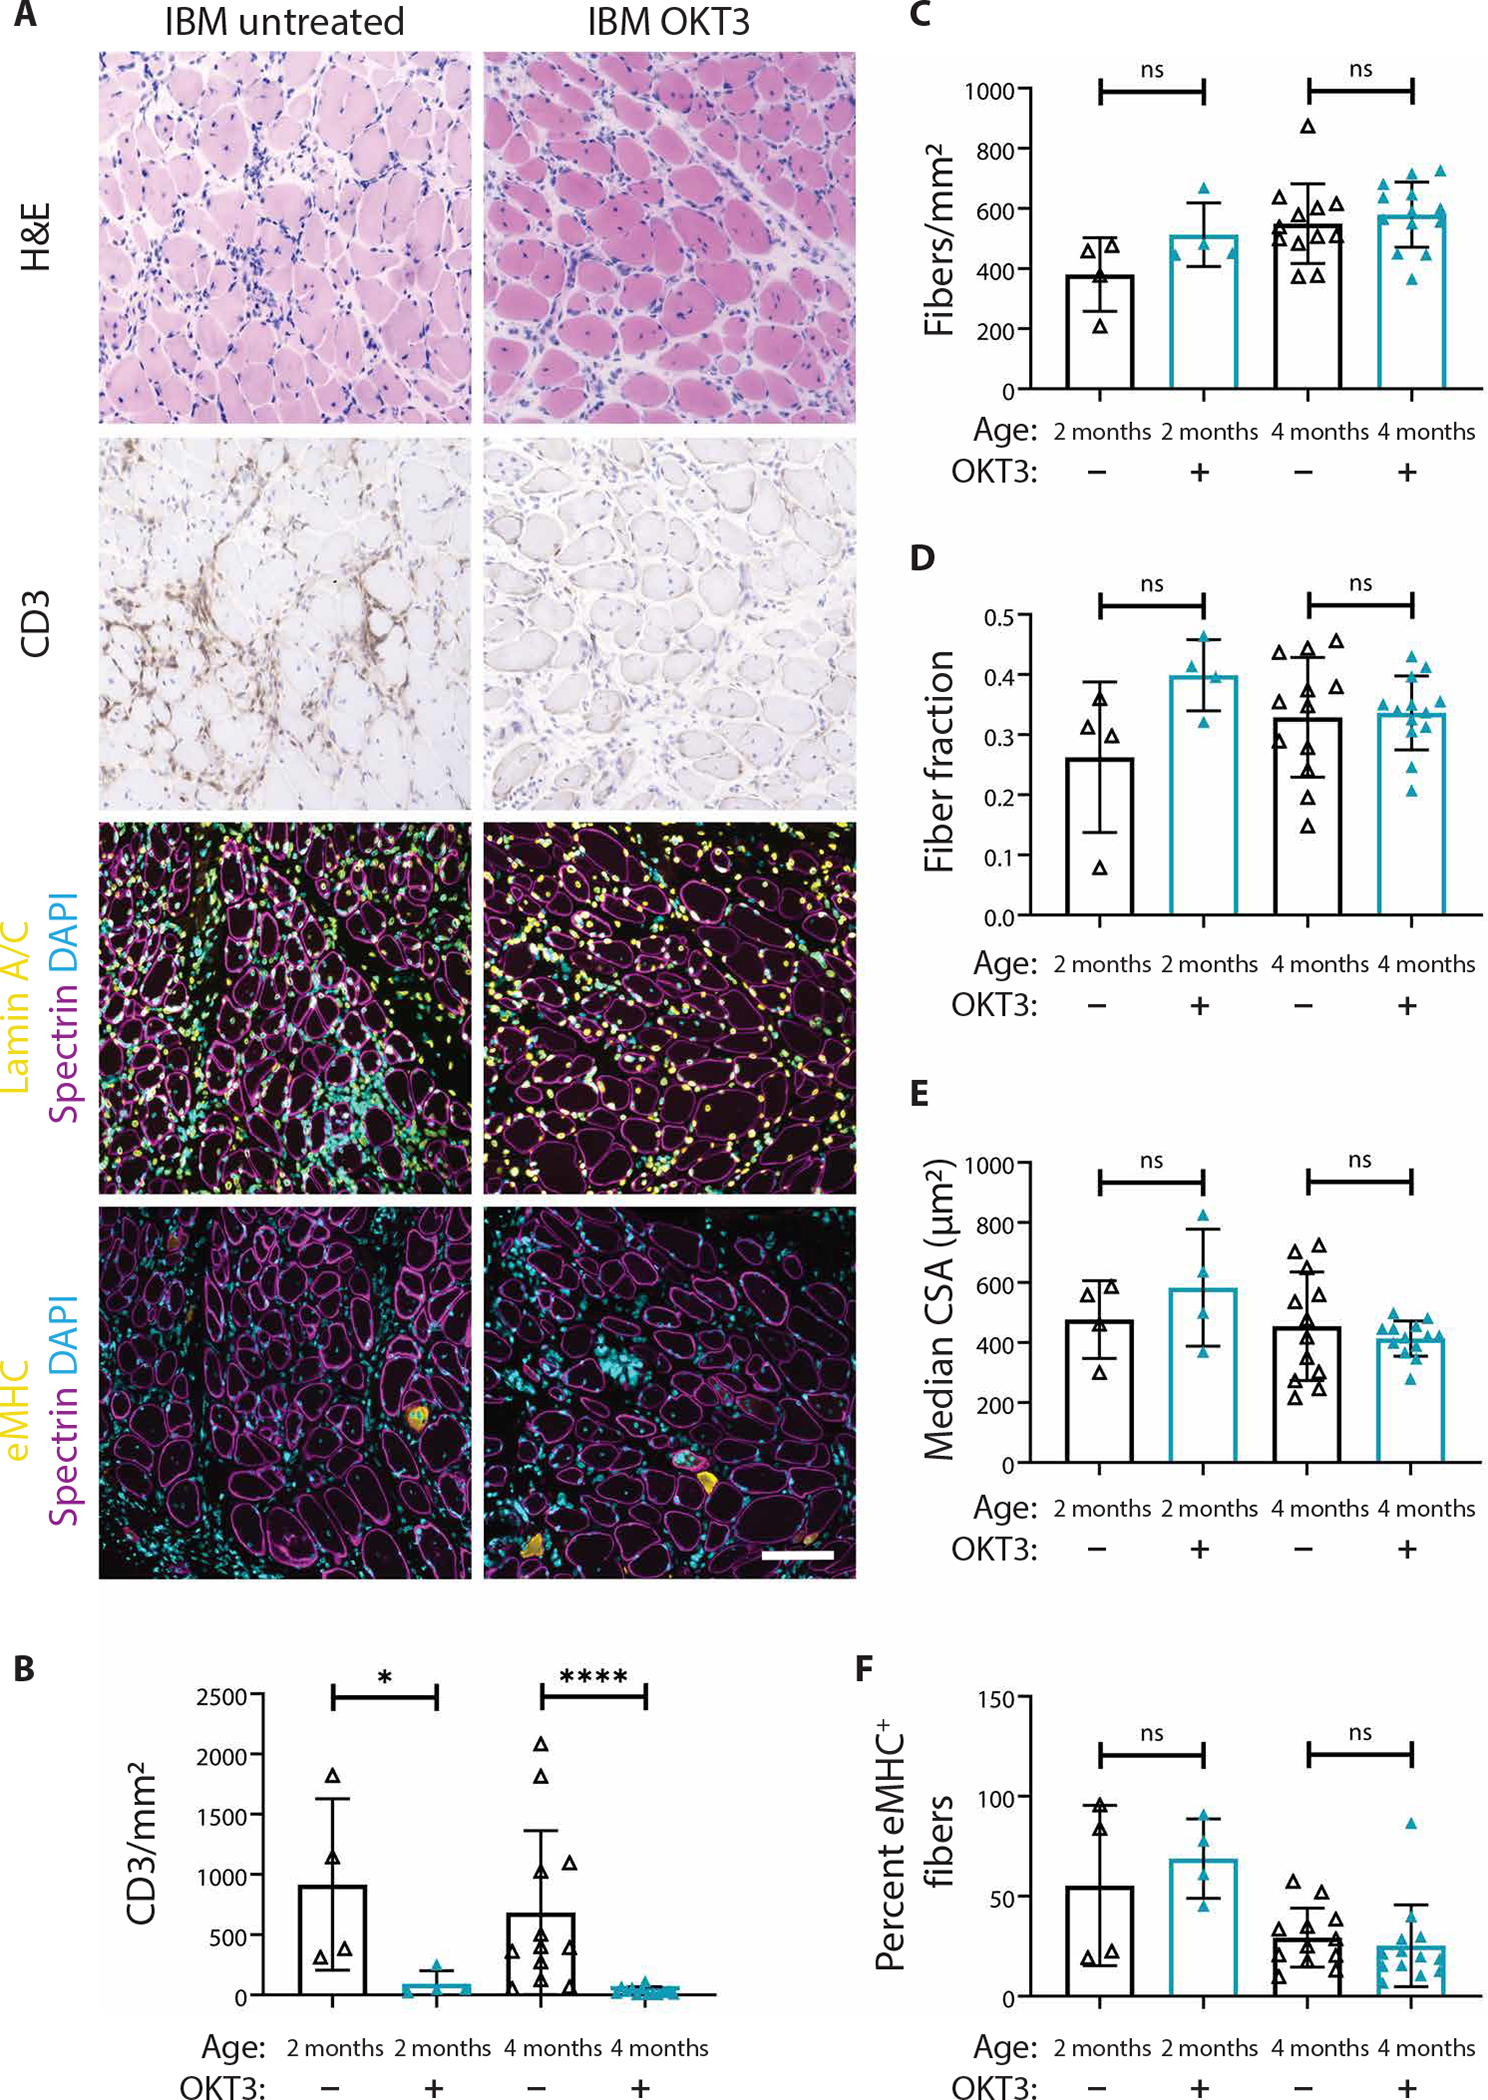
Fig. 7. OKT3 treatment ablates T cells from IBM xenografts but does not affect myofiber regeneration.

(A) Representative H&E, CD3, lamin A/C (yellow), spectrin (magenta), eMHC (yellow), and DAPI stains of 4-month untreated and OKT3-treated IBM xenografts. Scale bar, 100 μm. Quantification of the number of CD3+ T cells over the xenograft area (B), the number of fibers over the xenograft area (C), fiber fraction (D), median fiber CSA (E), and percentage of eMHC+ fibers (F) are shown. For all graphs, each point denotes one xenograft (2-month untreated, n = 4; 2-month OKT3, n = 4; 4-month untreated, n = 12; and 4-month OKT3, n = 13). Xenografts were obtained from four subjects with IBM (cases 23, 26, 36, and 42). Mann-Whitney U test was used to test for significance (*P < 0.05; ****P < 0.0001).
