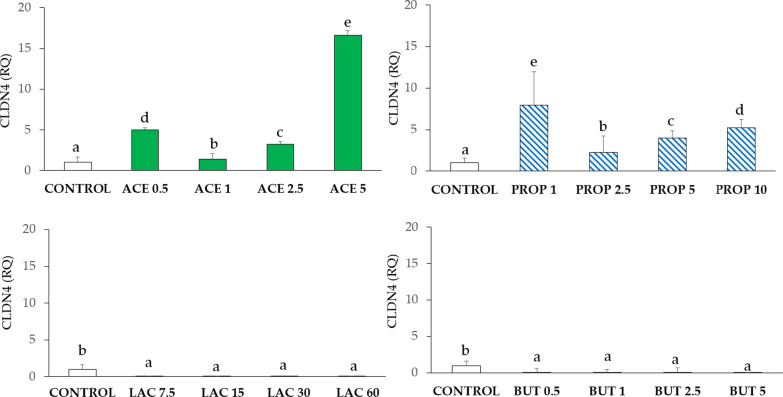
Fig. 5.
CLDN4 gene expression in IPEC-J2 cells (control) and in IPEC-J2 with SCFA supplementation (acetate, propionate, lactate, or butyrate). Each value represents the mean ± SD of 8 replicates of 7 independent experiments. Different letters indicate significant (P < 0.05) differences among groups. Data were analyzed according to the 2−ΔΔCt method in which the expression levels of the gene, normalized to the expression of the reference gene HPRT1, were expressed as relative quantities (RQ). The values were then normalized to the expression in the control group. The numbers in all treatment group designations refer to a mM concentration

