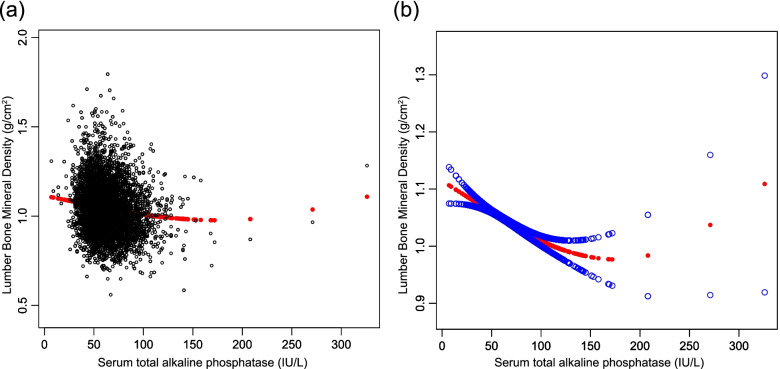
Fig. 1.
The correlation between serum total alkaline phosphatase and lumbar bone mineral density. a Each black point represents a sample. b The solid red line represents the smooth fitting curve between variables, and the blue band represents the 95% confidence interval of the fitting. (Age, sex, race/ethnicity, education, income to poverty ratio, waist circumference, smoking behavior, alcohol consumption, blood urea nitrogen, serum uric acid, total protein, total cholesterol, serum phosphorus, serum calcium and calcium supplementation were adjusted)

