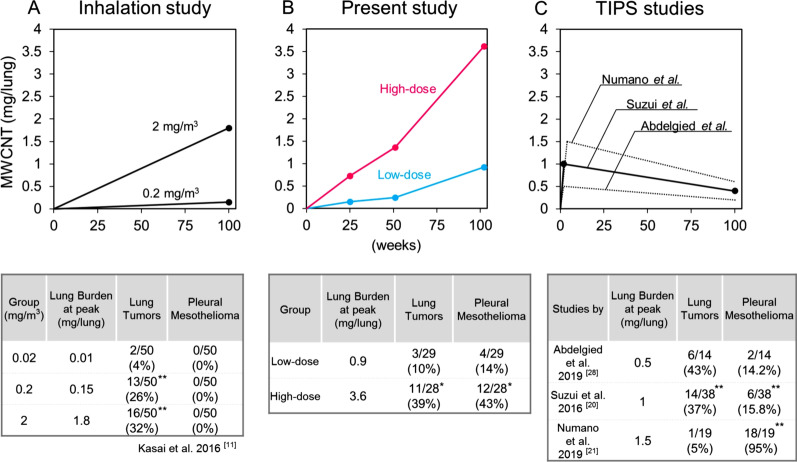
Fig. 9.
Comparisons of the AUC shape of MWCNT lung burden and tumor incidences. Upper: AUC curves of the lung burden of MWNT-7 during the experimental period in 3 types of experiments: inhalation study (results of only male rats were shown here) [11] (A), present study (B), and TIPS studies [20, 21, 28] (C). Circles show data points of the lung burden. In the studies by Abdelgied et al. and Numano et al., the lung burden was not measured; thus, predictive graphs are described by dotted lines, based on the dosages and data of Suzui et al. [20]. All lung burdens were measured by the same method (by Ohnishi et al.[60, 61]). Lower: summaries of peak lung burdens and incidences of lung tumor and pleural mesothelioma in each experiment. *, **: significant differences in each study. Test materials were MWNT-7 in all experiments except for a study by Suzui et al. (MWCNT-N) [20]

