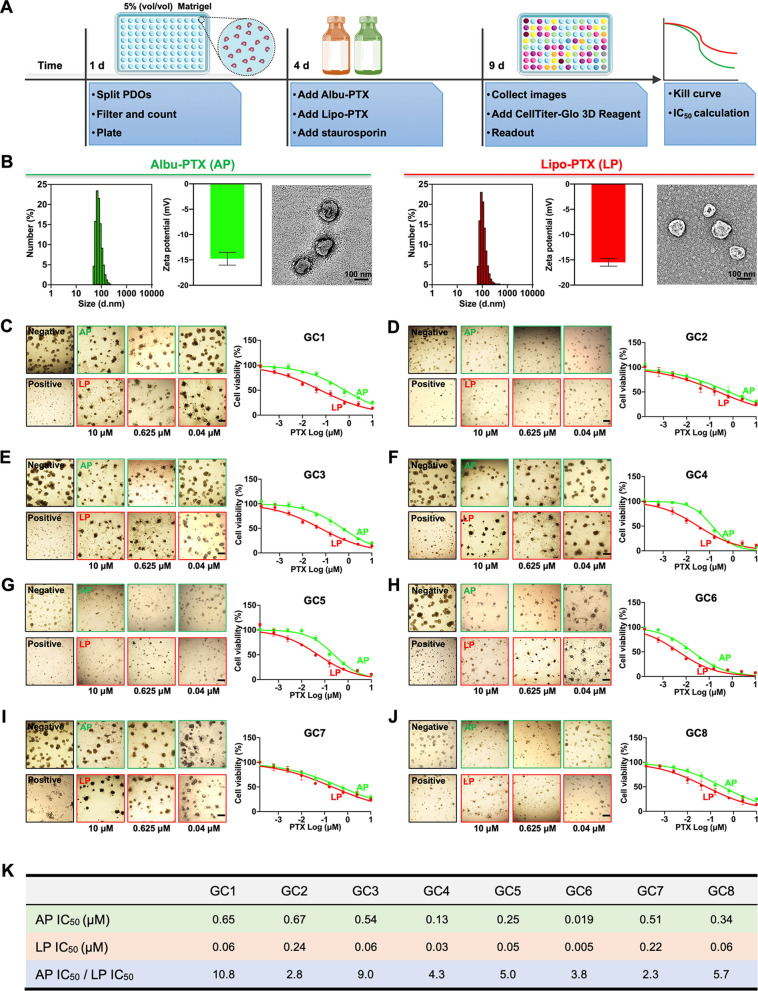
Fig. 3.
Response of GC PDOs to clinically used PTX nanoformulations. A Schematic overview of the drug sensitivity analysis protocol. B Size distributions, zeta potentials, and representative TEM images of Albu-PTX and Lipo-PTX. C–J Representative bright-field images and dose-response kill curves of various PDO lines treated with Albu-PTX or Lipo-PTX. PDOs were treated with PTX at concentrations ranging from 1.5 × 10− 4 µM to10 µM for 5 days. Scale bar, 200 μm. K IC50 values for various PDO lines. Data in (B–J) are presented as the means ± s.d (n = 3)

