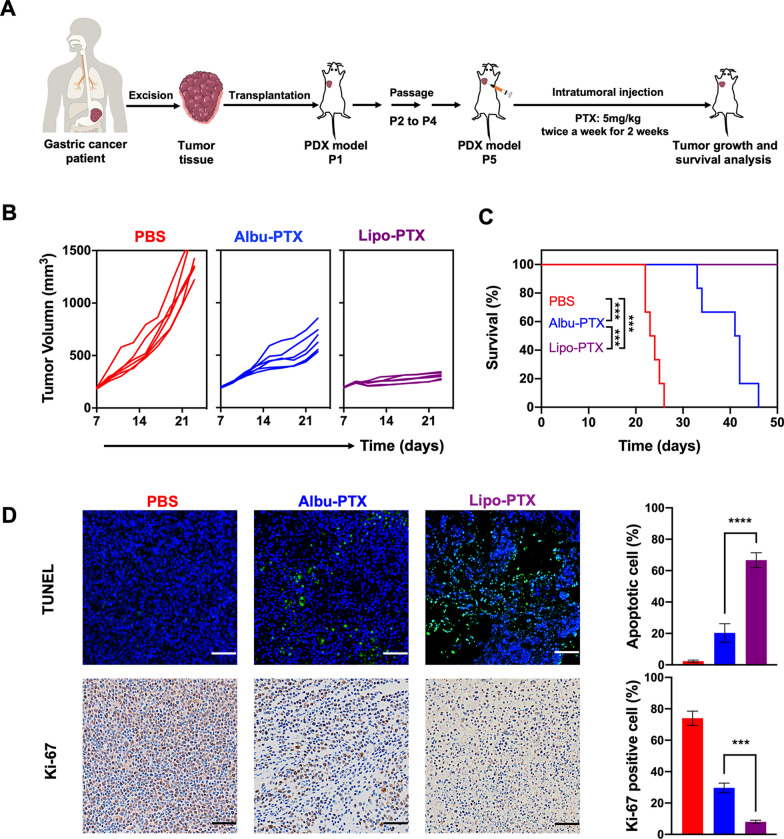
Fig. 6.
In vivo antitumor effects of intratumorally injected PTX nanoformulations in the GC1 PDX model. A Schematic illustration of GC1 PDX construction and the experimental design used in evaluation of the PDX response to intratumoral injection of PTX nanoformulations. B Individual growth kinetics of PDX tumors in different treatment groups (n = 6). C Survival curves of the mice in B. D TUNEL assay results and IHC analysis of Ki-67 expression in different treatment groups. Scale bar, 200 μm. Data in (D) are presented as the means ± s.d. (n = 3), and P values are determined by log-rank (Mantel-Cox) test (C) or one-way ANOVA with Tukey post-hoc test (D). ***P < 0.001 and ****P < 0.0001

