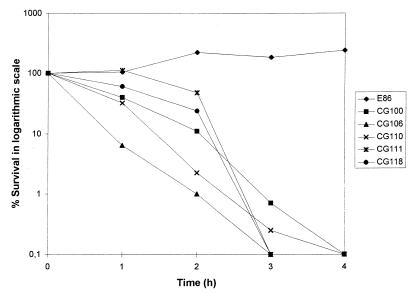
FIG. 2.
Survival curves in fresh eel serum. A volume of 20 μl of bacteria at the stationary phase of growth in saline solution (105 cells per ml) was mixed with 20 μl of serum. Viable counts were determined by drop plating of serial dilutions on TSA-1. Each point is the average value for three independent experiments.

