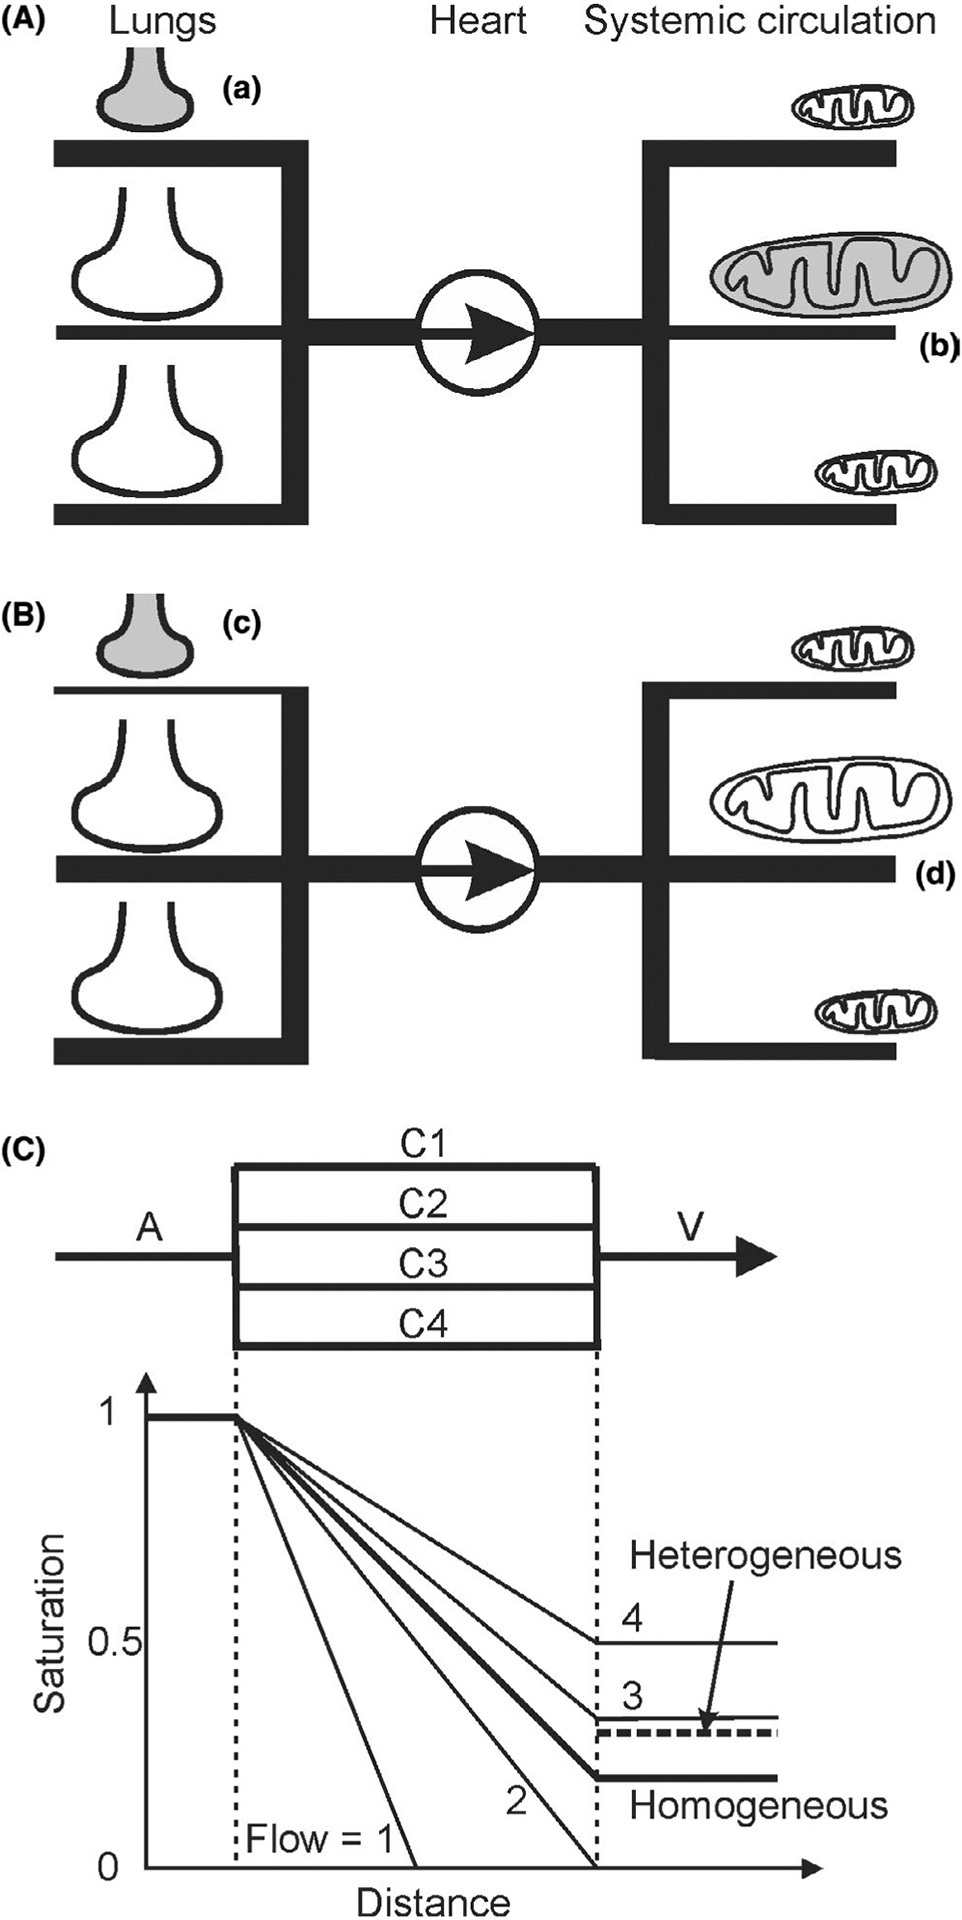
FIGURE 2.

Schematic diagrams indicating how lack of ventilation-perfusion matching or metabolism-perfusion matching can cause hypoxia. A, (a) In the lungs, if poorly ventilated alveoli (indicated by small shaded shape) receive high perfusion, then blood may be poorly oxygenated. Thicknesses of lines represent relative distribution of blood flow. (b) In the systemic circulation, if tissue regions with high metabolic demand by mitochondria (represented by large shaded shape) receive low perfusion, then oxygen supply may be inadequate. B, (c) Redistribution of flow in the lungs, for example, by hypoxic vasoconstriction, reduces flow to poorly ventilated regions, improving overall blood oxygenation. (d) Redistribution of flow in peripheral circulation, for example, by local metabolic regulation of blood flow, increases flow to regions of high metabolic demand, improving tissue oxygenation (represented by large unshaded shape). C, Effects of heterogeneous capillary flow rates on oxygen delivery. Oxygen saturation in arteriole A is set to 1. In the homogeneous case, capillaries C1-C4 all have flow of 2.5 (arbitrary units). Saturation in venule V is 0.2, that is, 80% extraction. In the heterogeneous case, the same flow is distributed (1, 2, 3, 4) to capillaries C1-C4. Mixed saturation in V is 0.3 (dashed line), that is, 70% extraction. C1 is anoxic along its downstream half, implying tissue hypoxia. For simplicity, oxygen delivery per unit length is held constant if saturation is above zero
