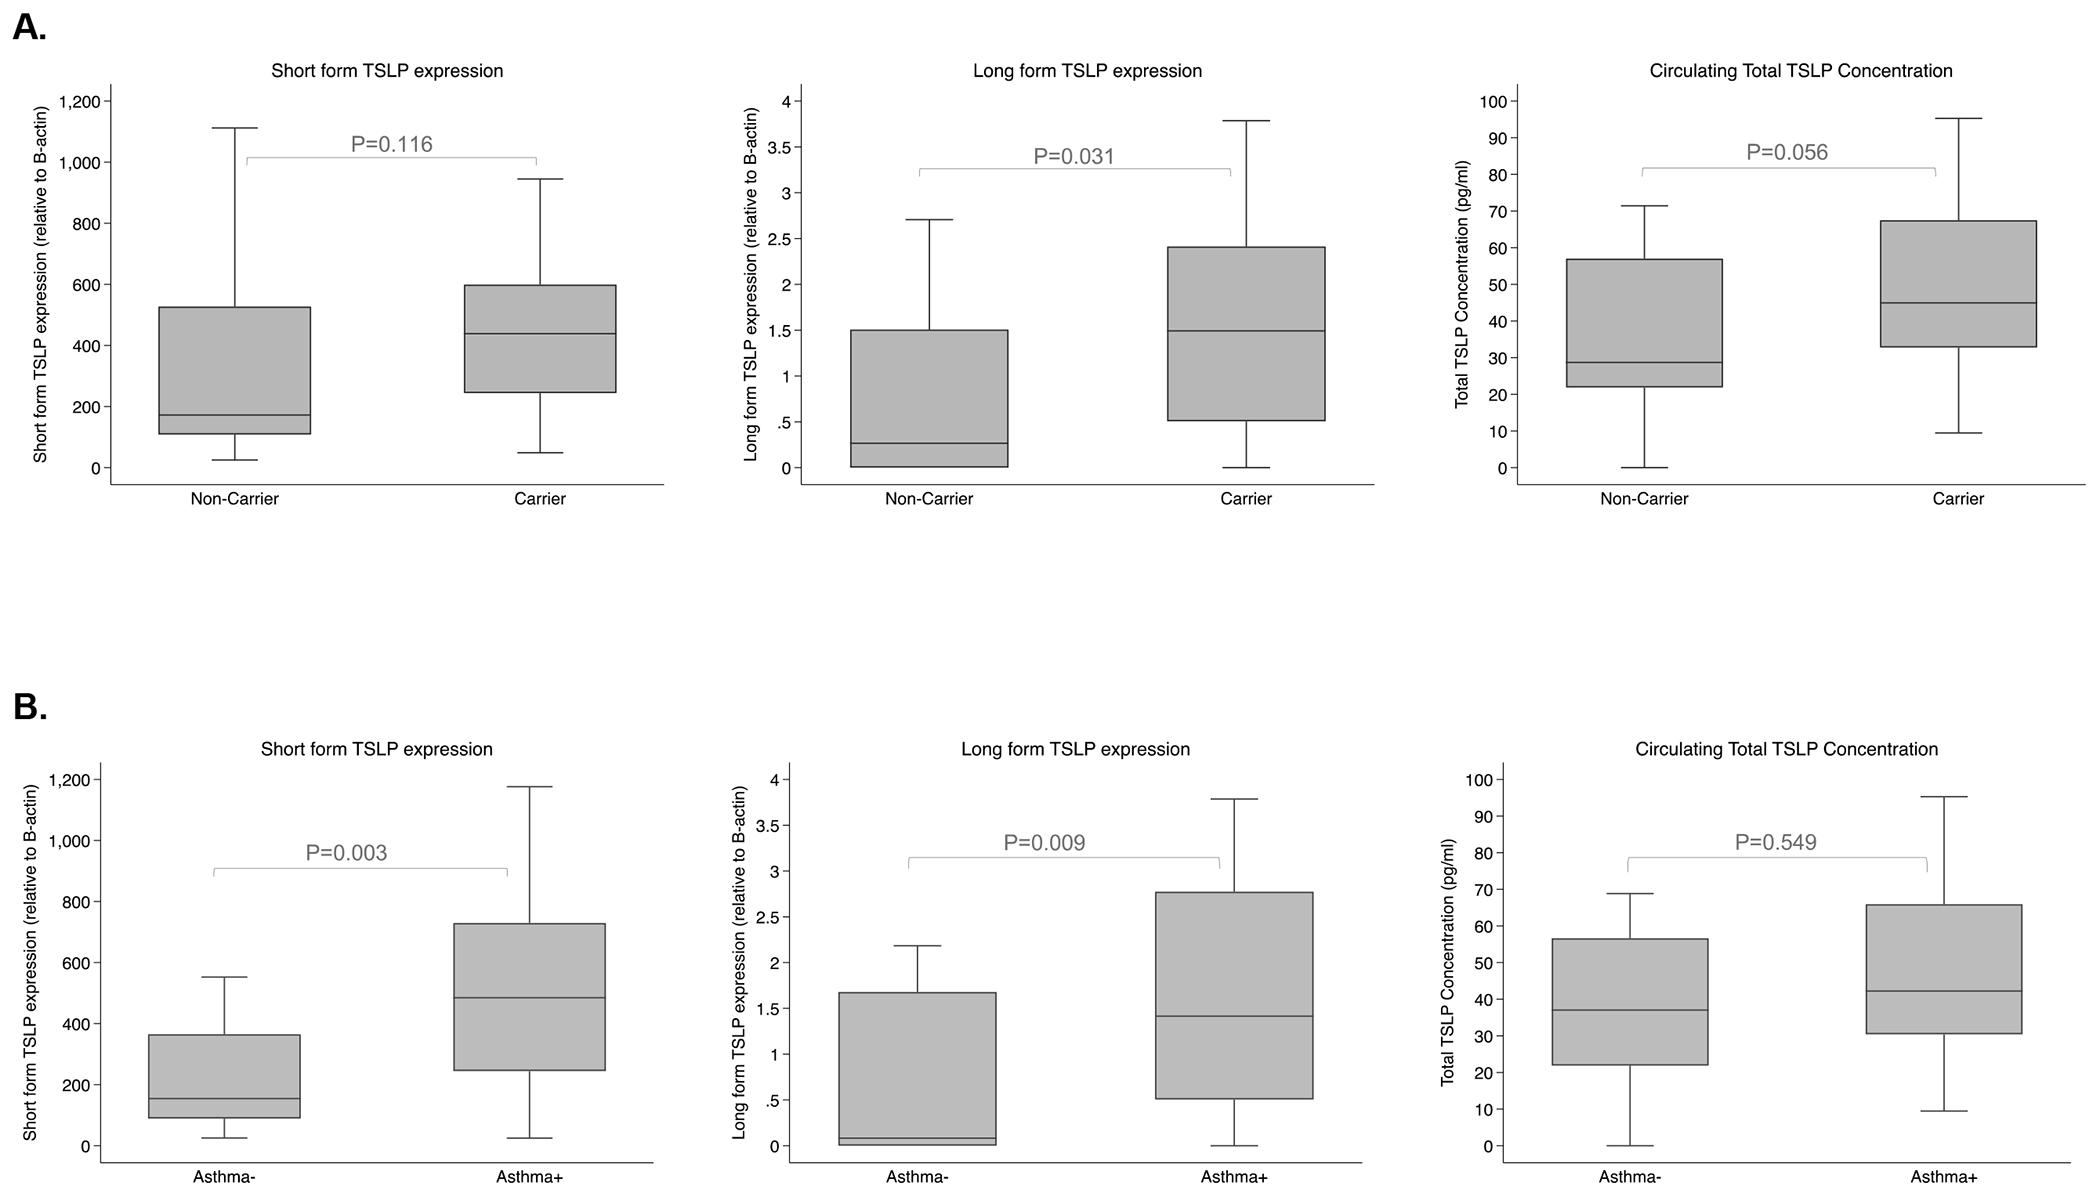
Figure 3. Median TSLP expression in nasal epithelial cells and median circulating TSLP concentration in plasma.

A) Median TSLP level by TSLP risk genotype. Differences in median long and short form TSLP expression (relative to B-actin) in nasal epithelium and total circulating TSLP concentration (pg/ml) levels in plasma comparing carriers with the TSLP risk genotype to non-carrier subjects without. P-value comparing TSLP levels in carriers and non-carriers using nonparametric Wilcoxon rank-sum test. Outliers (defined as 1.5 times the interquartile range above the upper quartile and below the lower quartile) are not shown for visualization purposes in this figure. Outliers were not removed from the analyses. B) Median TSLP level by asthma status. Differences in median short form and long form TSLP expression (relative to B-actin) in the nasal epithelium, total circulating TSLP concentration (pg/ml) levels in plasma comparing asthmatic and nonasthmatic children. P-value comparing asthmatic and nonasthmatic children using nonparametric Wilcoxon rank-sum test. Outliers (defined as 1.5 times the interquartile range above the upper quartile and below the lower quartile) are not shown for visualization purposes in this figure. Outliers were not removed from the analyses.
