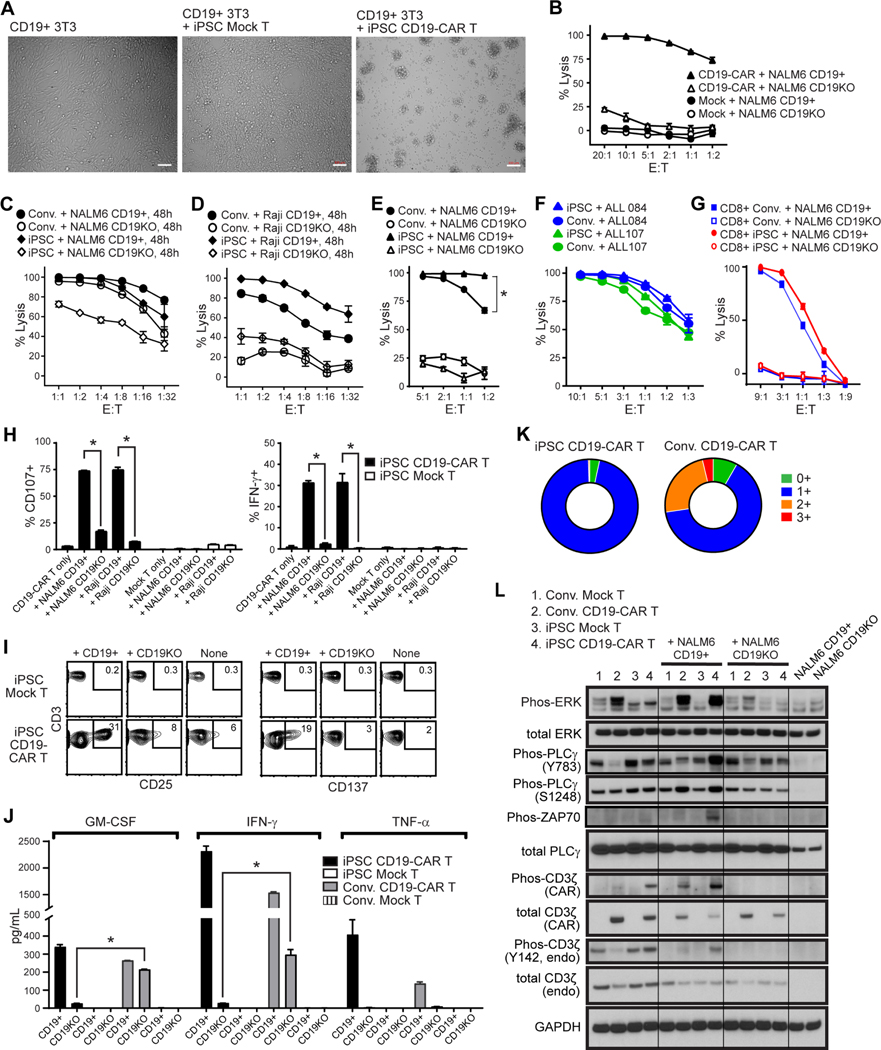
Figure 3. Functional profile of iPSC CD19-CAR T cells.
(A), Brightfield images after 4 hour co-culture of iPSC-derived mock-transduced (Mock) or CD19-CAR T cells with CD19+ 3T3 cells at an effector-to-target (E:T) ratio of 4:1. White bars indicate scale of 100 μm. (B-E), Cytotoxic activity of iPSC CD19-CAR T cells against CD19+ or CD19-negative/knockout (CD19KO) NALM6 (B, C, E), or Raji (D) target cells when co-cultured at the indicated E:T ratios for 4h (B, E) or 48h (C, D). Lytic activity was compared to that of iPSC-derived mock transduced T cells (MOCK, B) or conventional CD19-CAR T cells (Conv., C, D, E). Mean ± S.D. values of duplicate cultures are depicted. *, P < 0.001 by two way ANOVA test in (E). (F), Cytotoxic activity of iPSC-derived (iPSC) or conventional (Conv.) CD19-CAR T cells against patient derived ALL cells when co-cultured at the indicated E:T ratios for 4h. (G) Cytotoxic activity of flow cytometry sorted CD8+ iPSC-derived (CD8+ iPSC) or conventional CD8+ CD19-CAR T cells (CD8+ Conv.) against CD19+ or CD19-negative/knockout (CD19KO) NALM6. (H) Degranulation (i.e., surface CD107, left) and intracellular IFN-g levels (right) in iPSC-derived mock-transduced (Mock) or CD19-CAR T cells was measured by flow cytometry after co-culture with the indicated stimulator cells (X-axis labels) at an E:T ratio of 1:1 for 5 hours in the presence of the Golgi Stop protein transport inhibitor. *, P < 0.01 by Students t-test. (I) Flow cytometric analysis of activation markers were compared between iPSCderived Mock T and CD19-CAR T cells that were unstimulated (None), or stimulated with CD19+ or CD19-negative/knockout (CD19KO) NALM6 at an E:T ratio of 1:1 for 24 hours. Percentages of CD3+ cells expressing CD25 or CD137/4–1BB are indicated in each contour plot, with gates drawn based on isotype control staining. (J) Cytokine production by iPSC-derived or conventional (Conv.) Mock T or CD19-CAR T cells was measured by Bio-Plex analysis of supernatants harvested 24 hours after coculture with CD19+ or CD19-negative/knockout (CD19KO) NALM6 cells at an E:T ratio of 1:1. *, P < 0.001 by Student’s t-test. (K) T cell exhaustion marker profile of iPSC-derived or conventional (Conv.) CD19-CAR T cells after being re-challenged by CD19+ NALM6 cells every 2 days for a total of 3 stimulations at an E:T ratio of 1:2. Cells were stained with anti-PD-1, anti-TIM-3, anti-LAG-3 and percentages of CD3+ cells staining for no (0+), one (1+), two (2+) or all three (3+) markers were determined by flow cytometry. (L) Western Blot analysis of ERK, phosphorylated ERK, PLCγ, PLCγ phorphorylated at Y782, PLCγ phosphorylated at Ser1248, endogenous CD3ζ, phosphorylated endogenous CD3ζ, CD3ζ within the CAR, phosphorylated CD3ζ within the CAR, or GAPDH as a loading control in the indicated T cells cultured for 60 minutes alone, or with NALM6 tumors that are either CD19+ or CD19-negative (CD19KO). Tumor cells cultured alone were also examined as controls. Composites of individual images have been stitched together.

