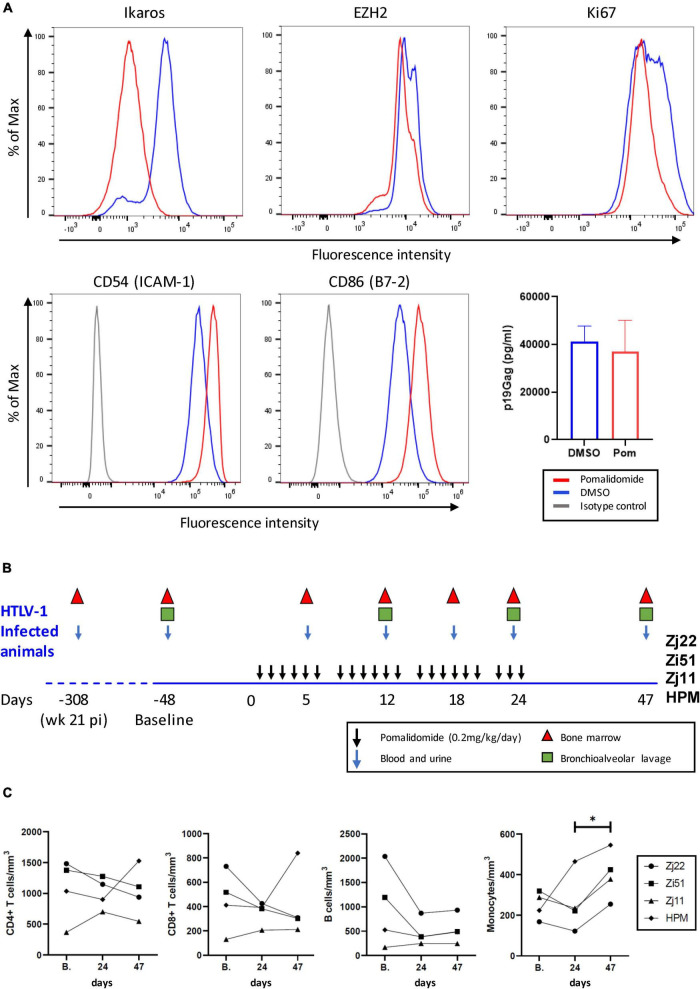
FIGURE 1.
Pomalidomide (Pom) treatment of HTLV-1 transformed cells and HTLV-1-infected rhesus macaques. (A) MT-2 cells were cultured for three days in Pom (10 μM) or vehicle (DMSO). Cells were stained for the intracellular factors Ikaros, EZH2, and Ki67, as well as surface-marker expression of CD54 (ICAM-1) or CD86 (B7-2). Representative graphs are shown of percentage of Max vs. Fluorescence Intensity and the supernatant p19Gag concentration from MT-2 cells after three days of culture with Pom (10 μM) or DMSO control. (B) Schematic diagram of Pomalidomide treatment and sample collection. Four rhesus macaques previously infected with HTLV-1 (31) were treated orally with 0.2 mg/kg/day of Pomalidomide on a schedule of 6 days of treatment (black arrows) and 1 day off over a 24 day period. Blood and urine (blue arrows), bone marrow (triangles), and bronchioalveolar lavage (squares), were collected as indicated. Twenty-three days after the last drug dose (day 47) final samples were collected. Baseline samples were collected 48 days before starting drug treatment (–48). (C) The absolute cell number in cells/mm2 for CD3+CD4+ T cells, CD3+CD8+ T cells, B-cells, and monocytes were graphed for blood samples for each animal at baseline (B.), day 24 when the last dose of Pom was given, and day 47. Animals are represented as follows: Zj22, circle; Zi51, square; Zj11, triangle; HPM, diamond (*p < 0.05).

