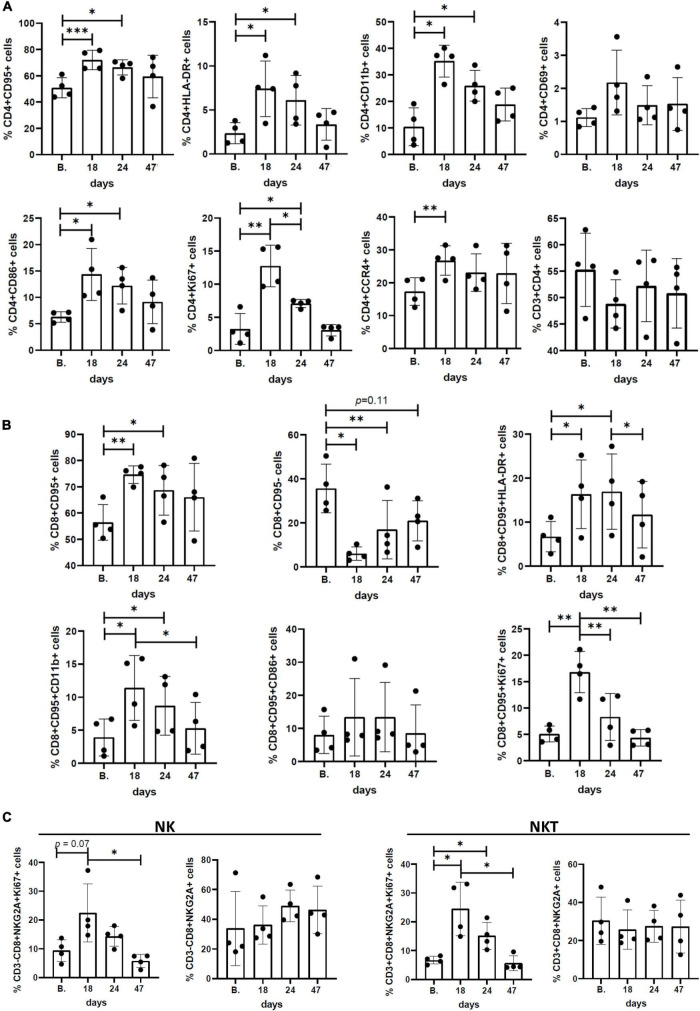
FIGURE 2.
Immunophenotypic profiles and surface/activation markers expression in peripheral blood mononuclear cells (PBMCs) isolated from Pom-treated animals. Graphs represent the frequency (%) of different subsets of (A) CD3+CD4+ cells, (B) CD3+CD8+CD95+ cells, and (C) CD3–CD8+NKG2a+ (NK) and CD3+CD8+NKG2a+ (NKT) cells at baseline (B.), day 18, day 24 (last dose of Pom), and day 47 (23 days after treatment). The mean ± standard deviation (error bars) is shown and p-values (*p < 0.05, **p < 0.01, and ***p < 0.001) are given above the columns.

