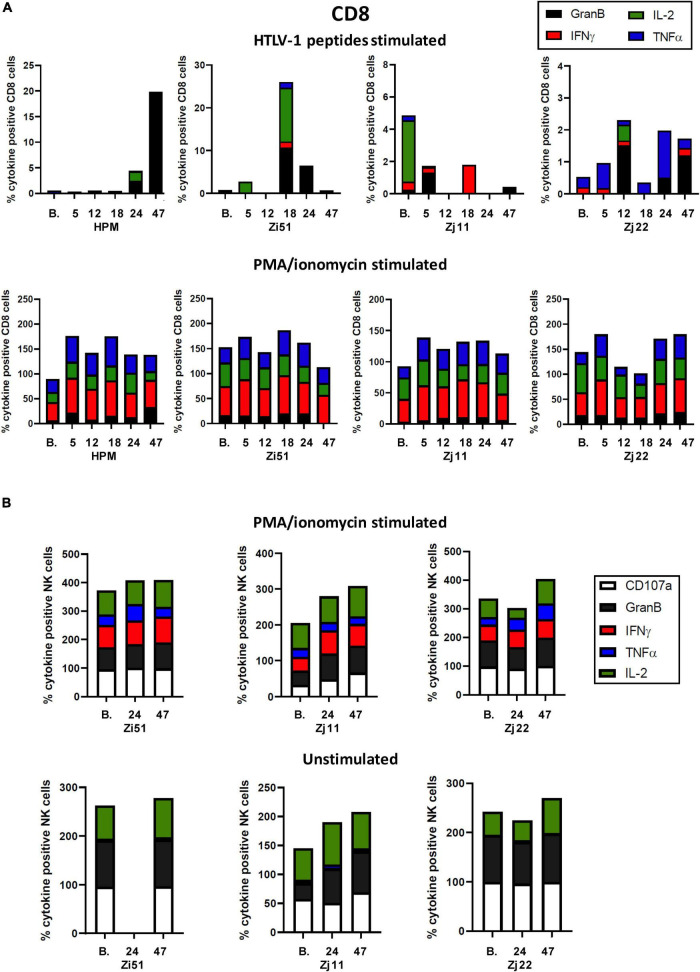
FIGURE 4.
CD8+ and NK cell responses in Pom-treated animals. (A) Plots of the frequency (%) of cytokine producing CD8+ cells over the course of the study are shown for each animal. Colors for individual cytokines/granzyme B (GranB) are indicated in the figure. The upper panels represent cultures stimulated with a peptide pool of overlapping 15-mer peptides spanning the HTLV-1 Tax and Gag proteins. The lower panels represent cultures stimulated with PMA/ionomycin. (B) NK cell responses were measured in unstimulated (lower panel) and PMA/ionomycin stimulated (upper panel) cells at baseline (B.) before Pom treatment, day 24 (24) at the last dose of Pom, and day 47 (47).

