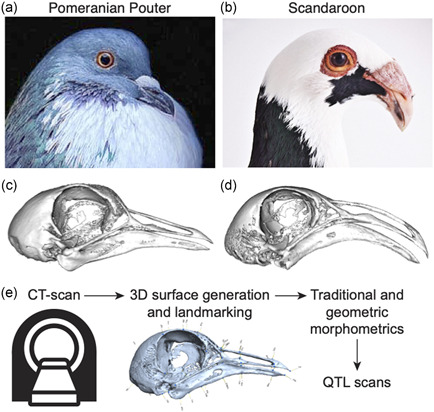
Figure 1.

Morphometric analyses of craniofacial shape and quantitative trait loci (QTL) mapping in a pigeon F2 intercross. (a, b) Representative images of the Pomeranian Pouter (Pom, a) and Scandaroon (Scan, b) breeds of domestic pigeon used to generate the Pom × Scan F2 intercross. (c, d) 3D surface models of the craniofacial skeletons of the male Pom (c) and one of the female Scan (d) cross founders. (e) Experimental approach to identify genetic architecture of craniofacial variation in the Pom × Scan cross. Image credits (used with permission): Drew Snyder (a); Richard Bailey (b). 3D, three‐dimensional; CT, computed tomography [Color figure can be viewed at wileyonlinelibrary.com]
